

Mining microarray expression data by literature profiling
- PMID: 12372143
- PMCID: PMC134484
- DOI: 10.1186/gb-2002-3-10-research0055
Mining microarray expression data by literature profiling
Abstract
Background: The rapidly expanding fields of genomics and proteomics have prompted the development of computational methods for managing, analyzing and visualizing expression data derived from microarray screening. Nevertheless, the lack of efficient techniques for assessing the biological implications of gene-expression data remains an important obstacle in exploiting this information.
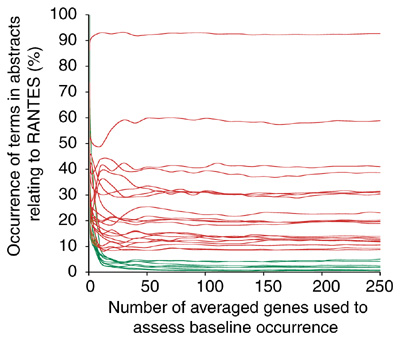
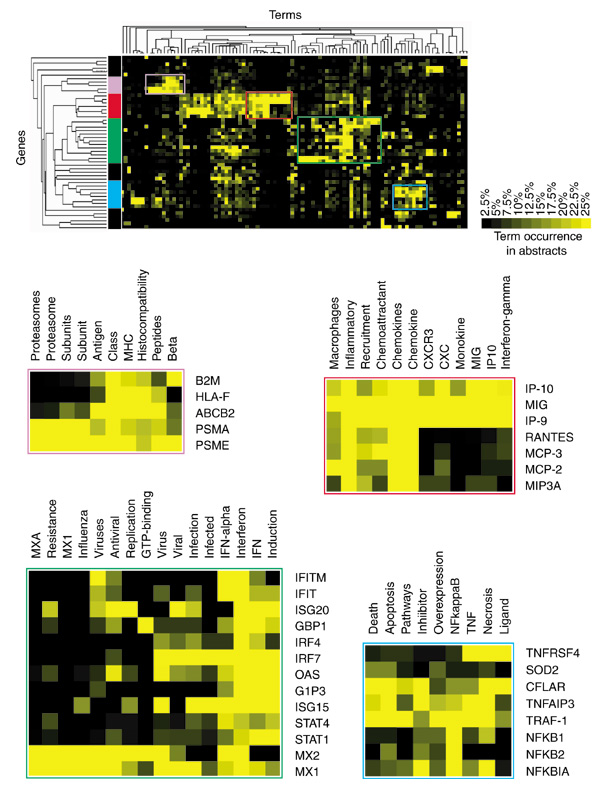
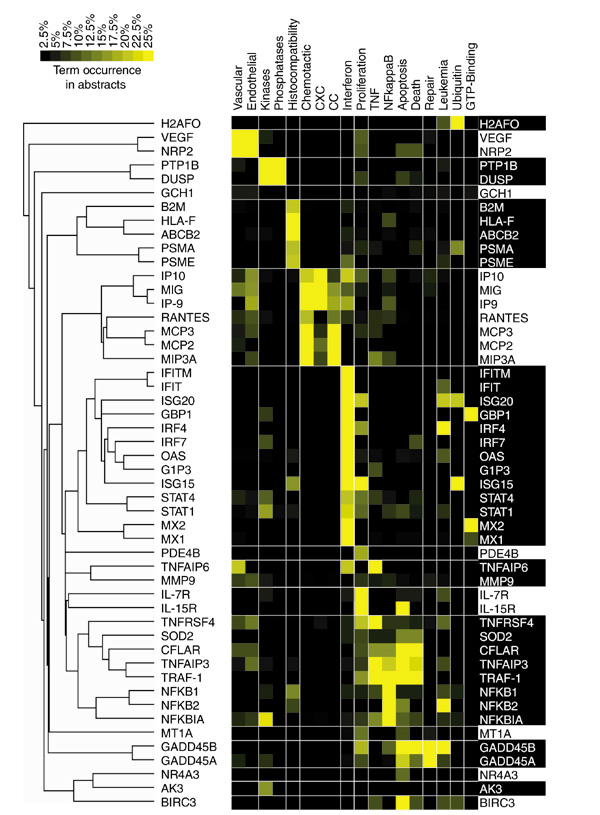
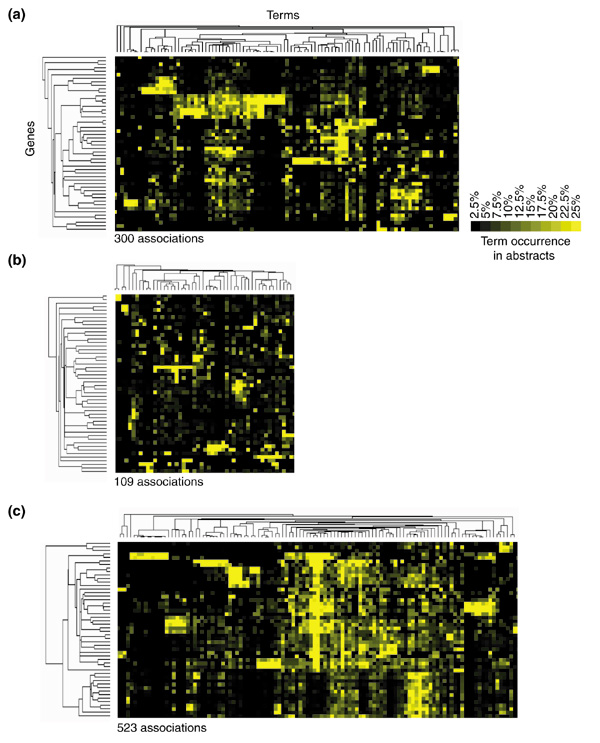
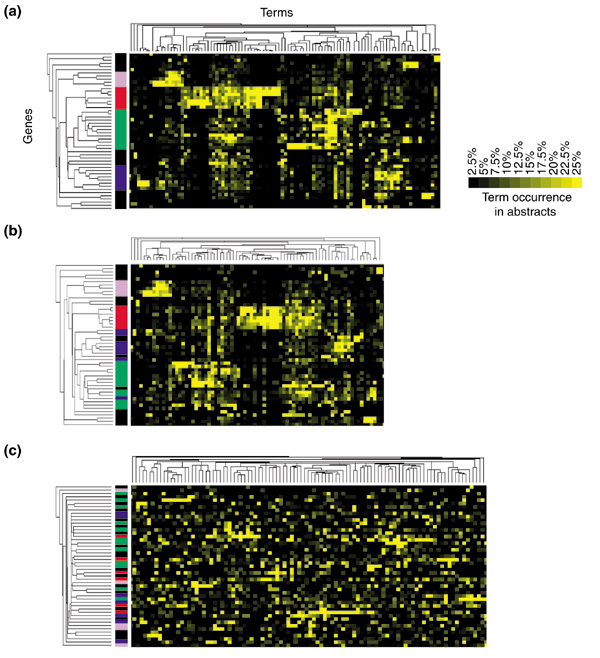
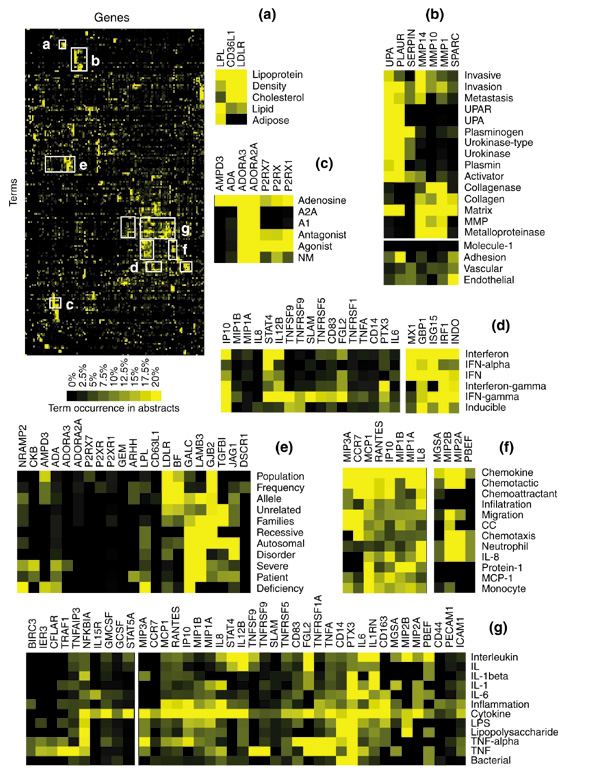
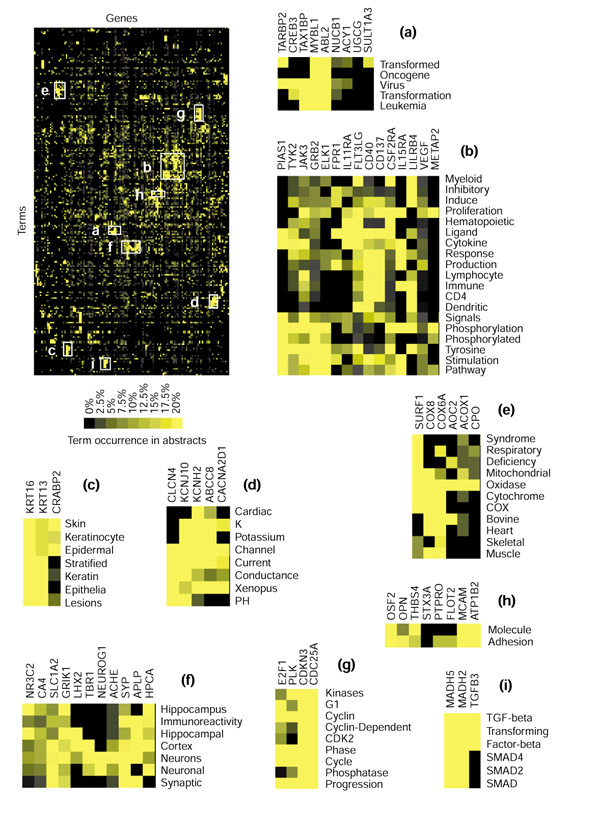
Results: To address this need, we have developed a mining technique based on the analysis of literature profiles generated by extracting the frequencies of certain terms from thousands of abstracts stored in the Medline literature database. Terms are then filtered on the basis of both repetitive occurrence and co-occurrence among multiple gene entries. Finally, clustering analysis is performed on the retained frequency values, shaping a coherent picture of the functional relationship among large and heterogeneous lists of genes. Such data treatment also provides information on the nature and pertinence of the associations that were formed.
Conclusions: The analysis of patterns of term occurrence in abstracts constitutes a means of exploring the biological significance of large and heterogeneous lists of genes. This approach should contribute to optimizing the exploitation of microarray technologies by providing investigators with an interface between complex expression data and large literature resources.
Figures
Similar articles
-
[Mining microarray gene expression data of metastatic colorectal cancer by literature profiling].Di Yi Jun Yi Da Xue Xue Bao. 2003 Nov;23(11):1195-7. Di Yi Jun Yi Da Xue Xue Bao. 2003. PMID: 14625187 Chinese.
-
[Mining gene expression microarray data of nasopharyngeal carcinoma by literature profiling].Di Yi Jun Yi Da Xue Xue Bao. 2004 Jul;24(7):798-801. Di Yi Jun Yi Da Xue Xue Bao. 2004. PMID: 15257907 Chinese.
-
MILANO--custom annotation of microarray results using automatic literature searches.BMC Bioinformatics. 2005 Jan 20;6:12. doi: 10.1186/1471-2105-6-12. BMC Bioinformatics. 2005. PMID: 15661078 Free PMC article.
-
Co-expression tools for plant biology: opportunities for hypothesis generation and caveats.Plant Cell Environ. 2009 Dec;32(12):1633-51. doi: 10.1111/j.1365-3040.2009.02040.x. Epub 2009 Aug 27. Plant Cell Environ. 2009. PMID: 19712066 Review.
-
Comparing algorithms for clustering of expression data: how to assess gene clusters.Methods Mol Biol. 2009;541:479-509. doi: 10.1007/978-1-59745-243-4_21. Methods Mol Biol. 2009. PMID: 19381534 Review.
Cited by
-
The computational analysis of scientific literature to define and recognize gene expression clusters.Nucleic Acids Res. 2003 Aug 1;31(15):4553-60. doi: 10.1093/nar/gkg636. Nucleic Acids Res. 2003. PMID: 12888516 Free PMC article.
-
Gene expression in cortex and hippocampus during acute pneumococcal meningitis.BMC Biol. 2006 Jun 2;4:15. doi: 10.1186/1741-7007-4-15. BMC Biol. 2006. PMID: 16749930 Free PMC article.
-
GOTree Machine (GOTM): a web-based platform for interpreting sets of interesting genes using Gene Ontology hierarchies.BMC Bioinformatics. 2004 Feb 18;5:16. doi: 10.1186/1471-2105-5-16. BMC Bioinformatics. 2004. PMID: 14975175 Free PMC article.
-
Martini: using literature keywords to compare gene sets.Nucleic Acids Res. 2010 Jan;38(1):26-38. doi: 10.1093/nar/gkp876. Epub 2009 Oct 25. Nucleic Acids Res. 2010. PMID: 19858102 Free PMC article.
-
A sentence sliding window approach to extract protein annotations from biomedical articles.BMC Bioinformatics. 2005;6 Suppl 1(Suppl 1):S19. doi: 10.1186/1471-2105-6-S1-S19. Epub 2005 May 24. BMC Bioinformatics. 2005. PMID: 15960831 Free PMC article.
References
-
- Schulze A, Downward J. Navigating gene expression using microarrays - a technology review. Nat Cell Biol. 2001;3:E190–E195. - PubMed
-
- Schulze A, Downward J. Analysis of gene expression by microarrays: cell biologist's gold mine or minefield? J Cell Sci. 2000;113:4151–4156. - PubMed
-
- Masys DR, Welsh JB, Lynn Fink J, Gribskov M, Klacansky I, Corbeil J. Use of keyword hierarchies to interpret gene expression patterns. Bioinformatics. 2001;17:319–326. - PubMed
-
- Tanabe L, Scherf U, Smith LH, Lee JK, Hunter L, Weinstein JN. MedMiner: an Internet text-mining tool for biomedical information, with application to gene expression profiling. Biotechniques. 1999;27:1210–1214. - PubMed
-
- Jenssen TK, Laegreid A, Komorowski J, Hovig E. A literature network of human genes for high-throughput analysis of gene expression. Nat Genet. 2001;28:21–28. - PubMed
MeSH terms
LinkOut - more resources
Full Text Sources
Other Literature Sources
