Comparative Study
. 2002 Sep 26;3(10):RESEARCH0058.
doi: 10.1186/gb-2002-3-10-research0058. Epub 2002 Sep 26.

Asymmetric directional mutation pressures in bacteria

Affiliations
Comparative Study

Asymmetric directional mutation pressures in bacteria

Jean R Lobry et al. Genome Biol. .

Abstract

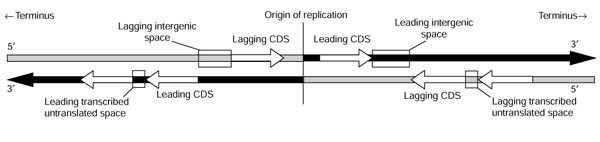
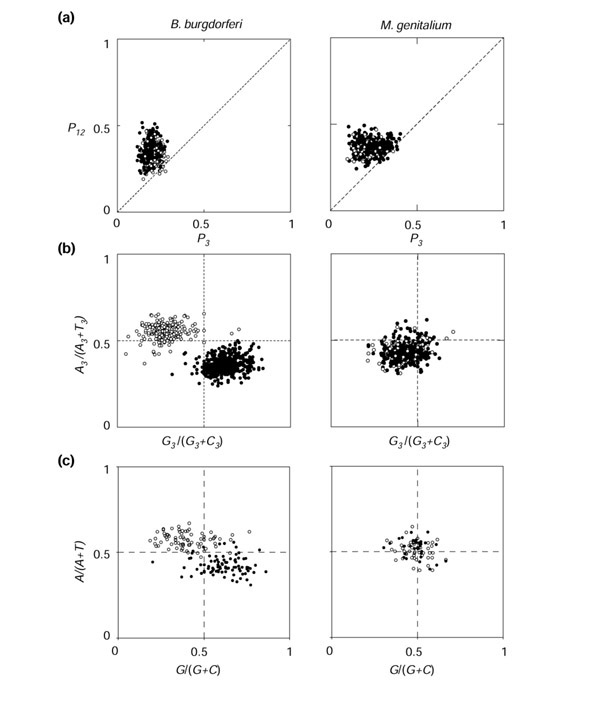
Background: When there are no strand-specific biases in mutation and selection rates (that is, in the substitution rates) between the two strands of DNA, the average nucleotide composition is theoretically expected to be A = T and G = C within each strand. Deviations from these equalities are therefore evidence for an asymmetry in selection and/or mutation between the two strands. By focusing on weakly selected regions that could be oriented with respect to replication in 43 out of 51 completely sequenced bacterial chromosomes, we have been able to detect asymmetric directional mutation pressures.

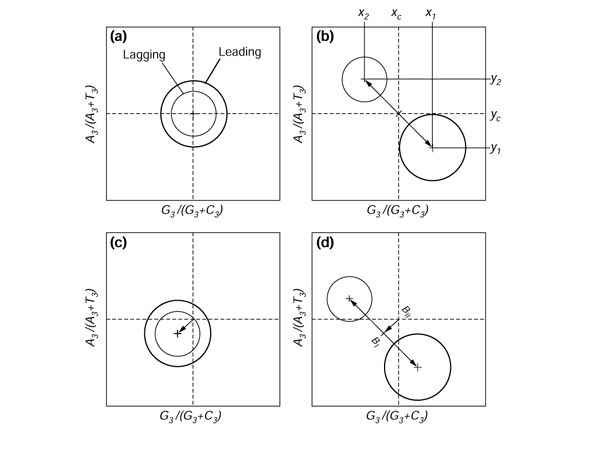
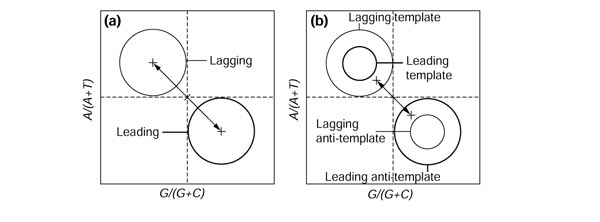
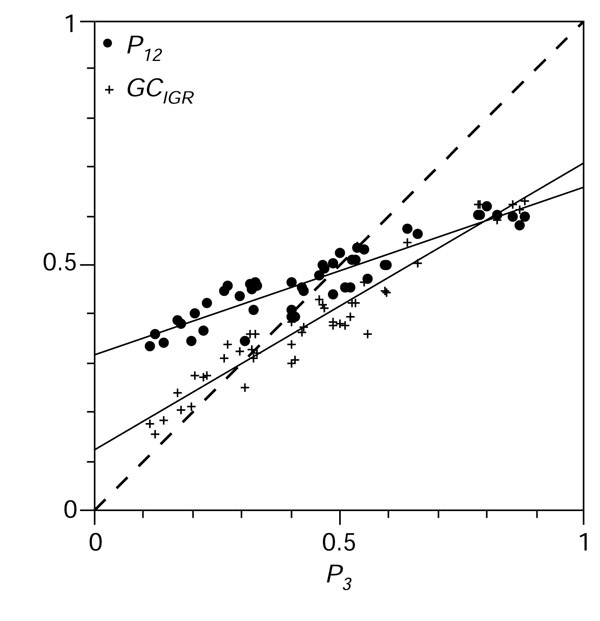
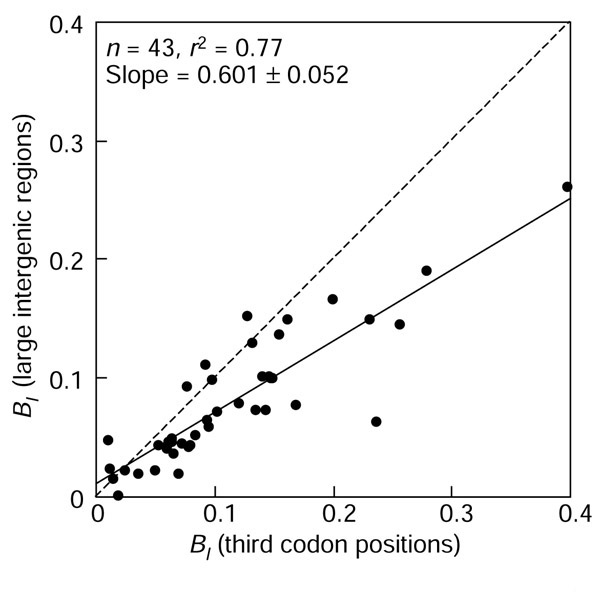
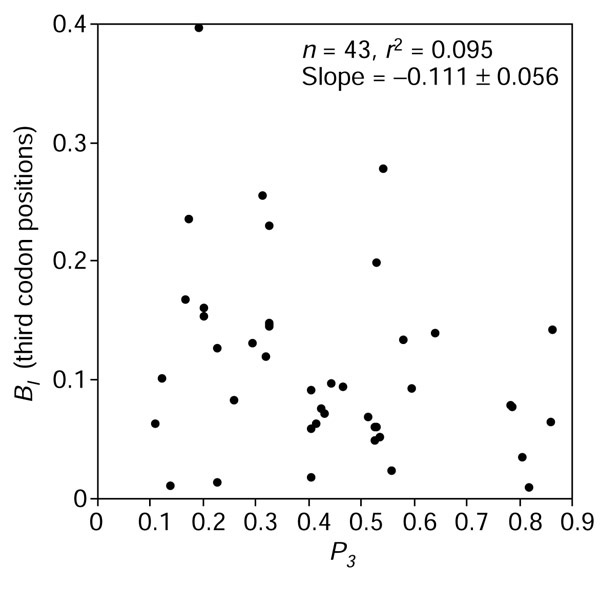
Results: Most of the 43 chromosomes were found to be relatively enriched in G over C and T over A, and slightly depleted in G+C, in their weakly selected positions (intergenic regions and third codon positions) in the leading strand compared with the lagging strand. Deviations from A = T and G = C were highly correlated between third codon positions and intergenic regions, with a lower degree of deviation in intergenic regions, and were not correlated with overall genomic G+C content.

Conclusions: During the course of bacterial chromosome evolution, the effects of asymmetric directional mutation pressures are commonly observed in weakly selected positions. The degree of deviation from equality is highly variable among species, and within species is higher in third codon positions than in intergenic regions. The orientation of these effects is almost universal and is compatible in most cases with the hypothesis of an excess of cytosine deamination in the single-stranded state during DNA replication. However, the variation in G+C content between species is influenced by factors other than asymmetric mutation pressure.


Figures

Figure 1
Figure 1
Representation of the strands used for analysis in this paper. The leading strand for replication is black and the lagging one is shaded gray; note the switch at the origin of replication. The sense strand of coding sequences is represented by white arrows. The sense sequence of a coding region that is transcribed in the same direction as the motion of the replication fork is in the leading strand, whereas a sense sequence that is transcribed in the opposite direction is in the lagging strand. The strand used for large intergenic spaces, represented by large boxes, is always the published strand from 5' to 3'. The strand used for potentially transcribed untranslated spaces, that is, small intergenic regions among co-oriented genes, is represented by small boxes.
Figure 2
Figure 2
Expected deviations in PR2 plots in coding sequences and small intergenic regions among co-oriented genes. (a) The null hypothesis: mutation and selection are symmetric with respect to the two DNA strands; (b) replication-induced mutation pressure is asymmetric; (c) transcription- or translation-associated mutation or selection pressures are asymmetric; (d) all forces in (b) and (c) combined are asymmetric.
Figure 3
Figure 3
Expected deviations in PR2 plots in large intergenic spaces (a) when replication-induced mutation pressure is asymmetric and (b) in an extreme case of asymmetric transcription-induced forces(see text for details).
Figure 4
Figure 4
Distribution of G+C content in the dataset. The G+C content of the 51 bacterial chromosomes under analysis was highly variable from 25.5% in the Ureaplasma urealyticum chromosome to 67.9% in Halobacterium sp., with a larger distribution in third codon positions (x-axis P3 from 11.2% to 88.0%) than in intergenic spaces (y-axis GCIGR from 15.5% to 63.4%) than in first and second position (y-axis P12 from 33.4% to 62.2%) as expected [10,11]. Regression slopes (or ε values) and their standard deviations for P12 and GCIGR were 0.343 ± 0.021 and 0.586 ± 0.024, respectively.
Figure 5
Figure 5
Example of detailed results for two extreme cases with B. burgdorferi (left) and M. genitalium (right). (a)P3-P12 plot for coding sequences; (b) PR2-plot in third codon position; (c) PR2 plot in large intergenic spaces. Leading-group sequences are represented by black circles, and lagging ones by white circles.
Figure 6
Figure 6
Comparison of the absolute contribution of replication-associated bias BI between intergenic and third codon positions.
Figure 7
Figure 7
Correlation between GC content and the extent of strand biases in third codon positions.

Similar articles

Cited by

References

    1. Lee KY, Wahl R, Barbu E. Contenu en bases puriques et pyrimidiques des acides désoxyribonucléiques des bactéries. Ann Inst Pasteur. 1956;91:212–224. - PubMed
    1. Belozersky AN, Spirin AS. A correlation between the compositions of deoxyribonucleic and ribonucleic acids. Nature. 1958;182:111–112. - PubMed
    1. Sueoka N, Marmur J, Doty P. Heterogeneity in deoxyriboneucleic acids. II. Dependence of the density of deoxyribonucleic acids on guanine-cytosine. Nature. 1959;183:1427–1431. - PubMed
    1. Rolfe R, Meselson M. The relative homogeneity of microbial DNA. Proc Natl Acad Sci USA. 1959;45:1039–1043. - PMC - PubMed
    1. Kerr ARW, Peden JF, Sharp PM. Systematic base composition variation around the genome of Mycoplasma genitalium, but not Mycoplasma pneumoniae. Mol Microbiol. 1997;25:1177–1179. - PubMed

Publication types

MeSH terms

LinkOut - more resources