. 2002 Oct;23(9):1516-23.

Experimental cerebral fat embolism: embolic effects of triolein and oleic acid depicted by MR imaging and electron microscopy

Affiliations

Experimental cerebral fat embolism: embolic effects of triolein and oleic acid depicted by MR imaging and electron microscopy

Hak Jin Kim et al. AJNR Am J Neuroradiol. 2002 Oct.

Abstract

Background and purpose: In fat embolism, free fatty acid is more toxic than neutral fat in terms of tissue damage. We evaluated the hyperacute embolic effects of triolein and oleic acid in cat brains by using MR imaging and electron microscopy.

Methods: T2-weighted imaging, diffusion-weighted imaging, and contrast-enhanced T1-weighted imaging were performed in cat brains after the injection of triolein (group 1, n = 8) or oleic acid (group 2, n = 10) into the internal carotid artery. MR images were quantitatively assessed by comparing the signal intensity ratios of the lesions with their counterparts on T2-weighted images, apparent diffusion coefficient (ADC) maps, and contrast-enhanced T1-weighted images. Electron microscopic findings in group 1 were compared with those in group 2.

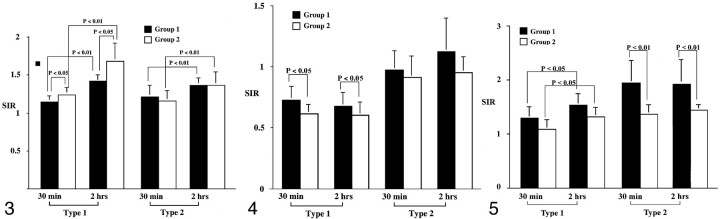
Results: Qualitatively, MR images revealed two types of lesions. Type 1 lesions were hyperintense on diffusion-weighted images and hypointense on ADC maps. Type 2 lesions were isointense or mildly hyperintense on diffusion-weighted images and isointense on ADC maps. Quantitatively, the signal intensity ratios of type 1 lesions in group 2 specimens were significantly higher on T2-weighted images (P =.013)/(P =.027) and lower on ADC maps compared with those of group 1. Electron microscopy of type 1 lesions in both groups revealed more prominent widening of the perivascular space and swelling of the neural cells in group 2, in contrast to notable endothelial defects in group 1.

Conclusion: MR and electron microscopic data on cerebral fat embolism induced by either triolein or oleic acid revealed characteristics suggestive of both vasogenic and cytotoxic edema in the hyperacute stage. Tissue damage appeared more severe in the oleic acid group than in the triolein group.


Figures

F<sc>ig</sc> 1.
Fig 1.
Group 1. MR images obtained 2 hours after cat brains were embolized with triolein show type 1 (solid arrow) and type 2 (open arrows) lesions. Type 2 lesions are bigger than type 1 lesions. A, T2-weighted (3000/96/2 [TR/TE/NEX]) image. Type 1 and type 2 lesions are hyperintense. B, Contrast-enhanced T1-weighted (320/30/2) image. Type 1 lesions show mild enhancement. Type 2 lesions show enhancement. C, Diffusion-weighted image. Type 1 lesions are hyperintense. Type 2 lesions have isointensity or slight hyperintensity. D, ADC map. Type 1 lesions are hypointense. Type 2 lesions are isointense.
F<sc>ig</sc> 2.
Fig 2.
Group 2. MR images obtained 2 hours after cat brains were embolized with oleic acid group show type 1 (solid arrow) and type 2 (open arrows) lesions. A, T2-weighted (3000/96/2) image. Type 1 lesions have mild hyperintensity. Type 2 lesions are hyperintense. B, Contrast-enhanced T1-weighted (320/30/2) image. Type 1 lesions show less enhancement than do type 2 lesions, which show strong enhancement. C, Diffusion-weighted image. Type 1 lesions are hyperintense. Type 2 lesions have isointensity or mild hyperintensity. D, ADC map. Type 1 lesions are hypointense. Type 2 lesions are isointense.
F<sc>ig</sc> 3.
Fig 3.
Bar graph of the signal intensity ratios on T2-weighted images. At 2 hours, the ratios in type 1 and type 2 lesions increase significantly in both groups (P < .001). The ratios of type 1 lesions are significantly higher in group 2 compared with group 1 at both 30 minutes and 2 hours (P = .013). However, in type 2 lesions, the ratios do not significantly differ in either group at either time (P > .643).
F<sc>ig</sc> 4.
Fig 4.
Bar graph of the signal intensity ratios on the ADC maps. Compared with the baseline value at 30 minutes, the ratios in types 1 and type 2 lesions did not change significantly at 2 hours in either group (P > .485). With the type 1 lesions, the ratios in group 2 were significantly lower than those in group 1 at each time point (P = .027). However, in type 2 lesions, the ratios were not significantly different in either group (P > .144).
F<sc>ig</sc> 5.
Fig 5.
Bar graph of the signal intensity ratios on contrast-enhanced T1-weighted images. Compared with the baseline values at 30 minutes, the ratios in type 1 lesions increase significantly at 2 hours in both groups (P = .034). In type 1 lesions, the ratios are not significantly different between group 1 and 2 at each time point (P > .051). However, in type 2 lesion, the ratios in group 1 are higher than those in group 2 at each time point (P < .001).
F<sc>ig</sc> 6.
Fig 6.
Electron microscopy findings in a type 1 lesion in a cat brain from group 1, which was treated with triolein (original magnification ×3000). Photomicrograph shows an intravascular fat vacuole (F) and defects in the endothelial wall (solid arrows). Areas of perivascular interstitial edema (asterisk) and neuropil swelling (arrowhead) are smaller than 5 μm in diameter. Open arrows represent red blood cells. Bar indicates 2 μm.
F<sc>ig</sc> 7.
Fig 7.
Electron microscopy findings in a type 1 lesion in a cat brain from group 1, which was treated with triolein (original magnification ×5000). The huge intravascular fat vacuole (F) distends the lumen and compresses the endothelial wall. The endothelial wall (arrows) is partly disrupted. Widening of the perivascular interstitial space (asterisks) is mild. Bar indicates 1 μm.
F<sc>ig</sc> 8.
Fig 8.
Electron microscopy findings in a type 1 lesion in a cat brain from group 2, which was treated with oleic acid (original magnification ×4000). Neuropil cells (arrowheads) are edematous, and widening of the interstitial space (asterisk) is prominent. Bar indicates 2 μm.
F<sc>ig</sc> 9.
Fig 9.
Electron microscopy findings in a type 1 lesion in a cat brains from group 2, which was treated with oleic acid (original magnification ×5000). A 5-μm intravascular fat vacuole (F) is shown. Neuropil swelling (arrowheads) is prominent, and widening of the perivascular interstitial space (asterisk) is also observed. Bar indicates 1 μm.

Similar articles

Cited by

References

    1. Nakata Y, Tanaka H, Kuwagata Y, Yoshioka T, Sugimoto H. Triolein-induced pulmonary embolization and increased microvascular permeability in isolated perfused rat lungs. J Trauma 1999;47:111–119 - PubMed
    1. Kim HJ, Lee CH, Lee SH, et al. Early development of vasogenic edema in experimental cerebral fat embolism in cat. Invest Radiol 2001;36:460–469 - PubMed
    1. Fonte DA, Hausberger FX. Pulmonary free fatty acids in experimental fat embolism. J Trauma 1971;11:668–672 - PubMed
    1. Peltier LF. Fat embolism, III: the toxic properties of neutral fat and free fatty acids. Surgery 1956;40:665–670 - PubMed
    1. Hagerty CS. Experimental embolic glomerulonephritis produced with human fat, fatty acids and calcium soaps. Arch Pathol 1938;25:24–34