

Case Reports
Visualization of microvascularity in glioblastoma multiforme with 8-T high-spatial-resolution MR imaging
Affiliations
- PMID: 12372746
- PMCID: PMC7976784
Item in Clipboard
Case Reports
Visualization of microvascularity in glioblastoma multiforme with 8-T high-spatial-resolution MR imaging
AJNR Am J Neuroradiol.
2002 Oct.
Abstract
We used 8-T high-spatial-resolution gradient-echo MR imaging to directly visualize microvascularity in pathologically proved glioblastoma multiforme. Images were compared with 1.5-T high-spatial-resolution fast spin-echo T2-weighted images and digital subtraction angiograms. Preliminary data indicate that 8-T high-spatial-resolution MR imaging may enable the identification of areas of abnormal microvascularity in glioblastoma multiforme that are not visible with other routine clinical techniques.
Figures
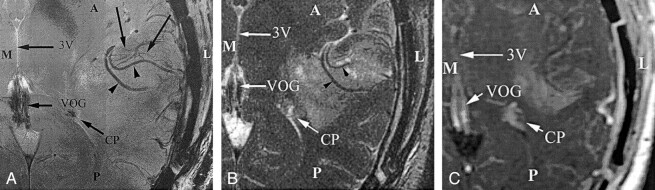
Comparison of MR images obtained at the inferior border of a glioblastoma multiforme. Although the arterial structures in the sylvian fissure (arrowheads) are identified at both 1.5- and 8-T imaging, the smaller venous structures (unlabeled arrows) are depicted only on the 8-T image. These venous structures represent draining veins from the tumoral bed. A indicates anterior; CP, choroid plexus within the trigone of the left lateral ventricle; L, lateral; M, medial; P, posterior; VOG, vein of Galen; and 3V, third ventricle. A, Image obtained at 8 T (714/10, 23° flip angle, 900 × 900 matrix, 2-mm section thickness, 20-cm FOV). B, FSE T2-weighted image obtained at 1.5 T (5650/104, 512 × 512 matrix, 3-mm section thickness, 20-cm FOV). C, Gadolinium-enhanced magnetization-transfer image obtained at 1.5 T (616/20, 256 × 256 matrix, 5-mm section thickness).
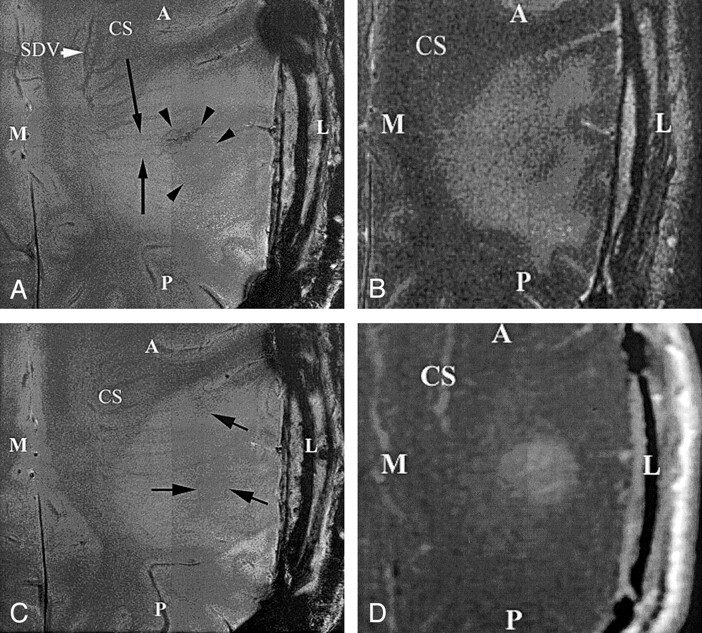
Axial images obtained through the superior aspect in patient with a glioblastoma multiforme demonstrate the ability to identify the fine angioarchitecture associated with the tumor at 8 T but not at 1.5 T. Note the enlargement and tortuosity of the transmedullary veins coursing over the tumor bed (long arrows), as compared with those in a healthy patient. The signal-intensity voids in the tumoral bed connect to the transmedullary veins (short arrows). Also note the area of overall decreased signal intensity that is associated with haphazardly arranged vessels, which are thought to represent neovascularity (arrowheads). A indicates anterior; CS, centrum semiovale; L, lateral; M, medial; P, posterior; SDV, subependymal draining vein. A, Image obtained at 8 T (714/10, 23° flip angle, 900 × 900 matrix, 2-mm section thickness, 20-cm FOV). B, FSE T2-weighted 1.5-T image (5650/104, 512 × 512 matrix, 3-mm section thickness, 20-cm FOV). C, Image obtained at 8 T at one section superior to that in B (714/10, 23° flip angle, 900 × 900 matrix, 2-mm section thickness, 20-cm FOV). D, Gadolinium-enhanced T1-weighted magnetization transfer images (616/20, 256 × 256 matrix, 5-mm section thickness).
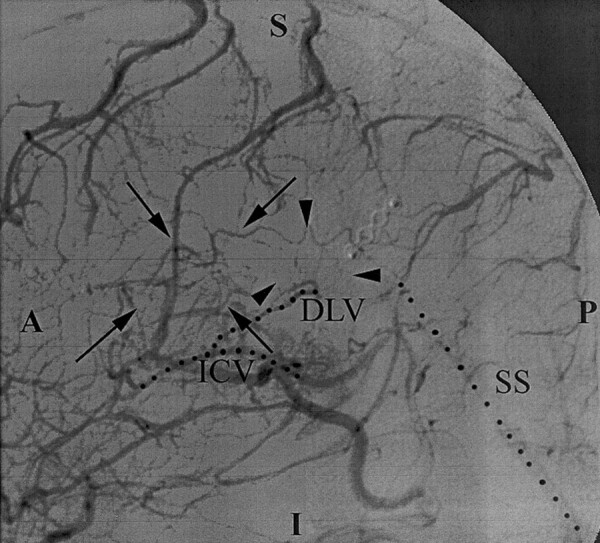
Lateral arteriogram obtained with a left carotid injection demonstrates tortuous vascularity (arrows and arrowheads) in the tumor bed within the glioblastoma multiforme. These findings were also identified on the 8-T images (Figs 1 and 2). However, the normal transmedullary veins and the smaller vessels are less conspicuous on DSA images than on 8-T images. A indicates anterior; DLV, direct lateral vein; I, inferior; ICV, internal cerebral vein; P, posterior; and SS, straight sinus.
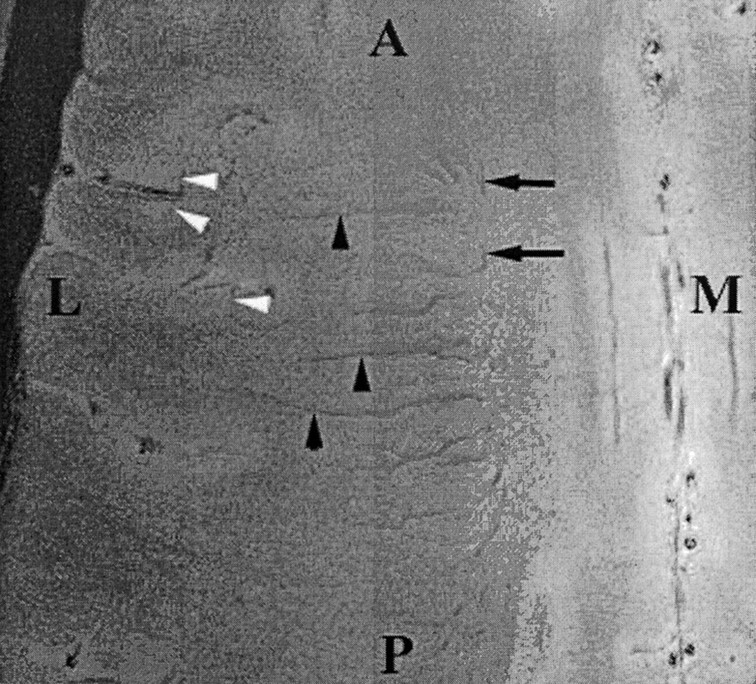
Axial gradient-echo 8-T MR images (600/12, 23° flip angle, 2-mm section thickness, 1024 × 1024 matrix, 20-cm FOV) display the medullary veins in the head of a healthy volunteer. The image is centered at the centrum semiovale and shows many transmedullary veins (black arrowheads) that drain into the subependymal veins (arrows), which are depicted as linear signal intensity voids converging on the surface of the lateral ventricles. Also note the cortical penetrating veins (white arrowheads). A indicates anterior; L, lateral; M, medial; and P, posterior.
Comment in
-
The clinical relevance and scientific potential of ultra high-field-strength MR imaging.AJNR Am J Neuroradiol. 2002 Oct;23(9):1441-2. AJNR Am J Neuroradiol. 2002. PMID: 12372729 Free PMC article. No abstract available.
References
-
- Kleihues P, Burger PC, Plate KH, Ohgaki H, Cavanee WK. Glioblastoma. In: Kleihues P, Cavenee WK, eds. Pathology and genetics of Tumours of the Nervous System. Lyon: International Agency for Research on Cancer;1997. :22
-
- Brem S, Cotran R, Folkman J Tumor angiogenesis: a quantitative method for histologic grading. J Natl Cancer Inst 1972;48:347–356 - PubMed
-
- Weidner N. Tumoral vascularity as a prognostic factor in cancer patients: the evidence continues to grow. J Pathol 1998;184:119–122 - PubMed
-
- Eberhard A, Kahlert S, Goede V, Hemmerlein B, Plate KH, Augustin HG. Heterogeneity of angiogenesis and blood vessel maturation in human tumors: implications for antiangiogenic tumor therapies. Cancer Res 2000;60:1388–1393 - PubMed
Publication types
MeSH terms
Grants and funding
LinkOut - more resources
Full Text Sources
Other Literature Sources
Medical