

Hydrogen peroxide activates cell death and defense gene expression in birch
- PMID: 12376624
- PMCID: PMC166586
- DOI: 10.1104/pp.003954
Hydrogen peroxide activates cell death and defense gene expression in birch
Abstract
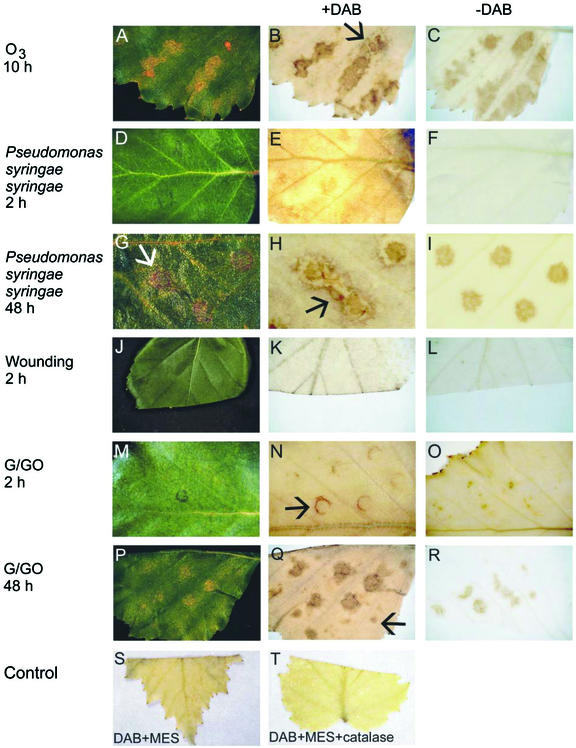
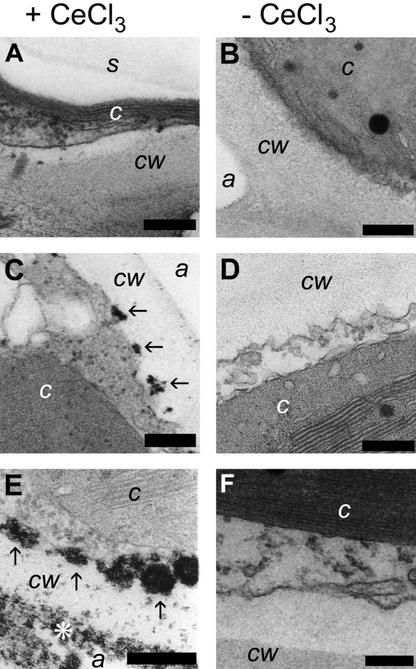
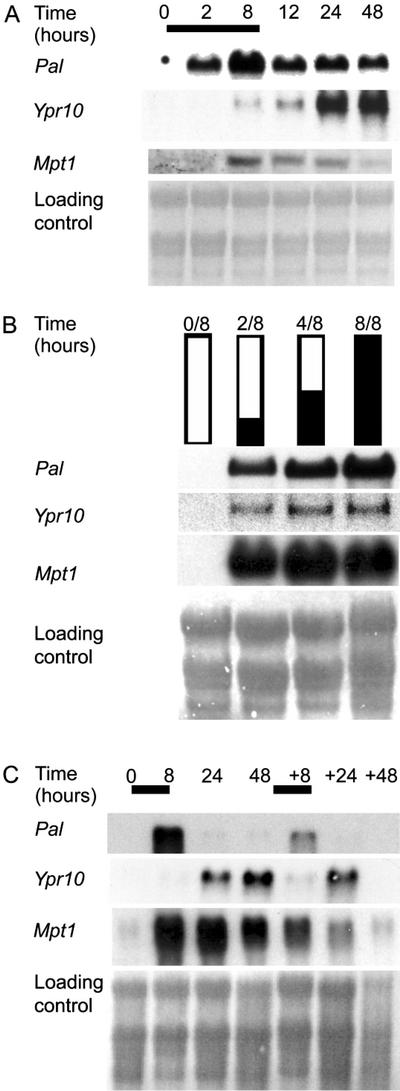
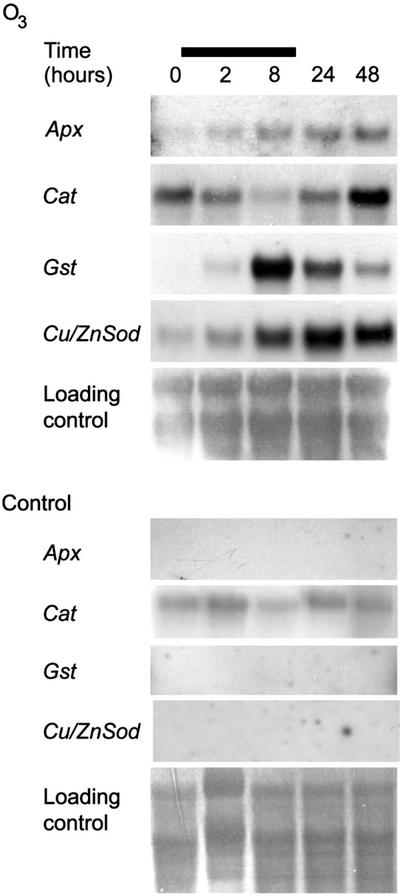
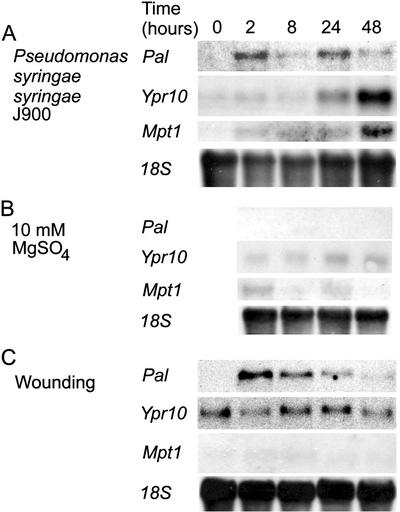
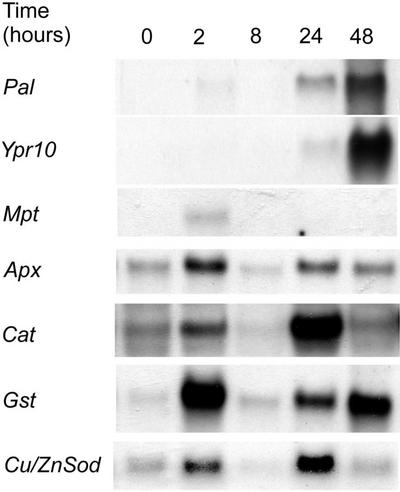
The function of hydrogen peroxide (H(2)O(2)) as a signal molecule regulating gene expression and cell death induced by external stresses was studied in birch (Betula pendula). Ozone (O(3)), Pseudomonas syringae pv syringae (Pss), and wounding all induced cell death of various extents in birch leaves. This was temporally preceded and closely accompanied by H(2)O(2) accumulation at, and especially surrounding, the lesion sites. O(3) and Pss, along with an artificial H(2)O(2) producing system glucose (Glc)/Glc oxidase, elicited elevated mRNA levels corresponding to genes encoding reactive oxygen species detoxifying enzymes, Pal, Ypr10, and mitochondrial phosphate translocator 1. In addition to the regulation of gene expression, Glc/Glc oxidase also induced endogenous H(2)O(2) production in birch leaves, accompanied by cell death that resembled O(3) and Pss damage. Wound-induced gene expression differed from that induced by O(3) and Pss. Thus, it appears that at least two separate defense pathways can be activated in birch leaves by stress factors, even though the early H(2)O(2) accumulation response is common among them all.
Figures
Similar articles
-
Differential gene expression in senescing leaves of two silver birch genotypes in response to elevated CO2 and tropospheric ozone.Plant Cell Environ. 2010 Jun;33(6):1016-28. doi: 10.1111/j.1365-3040.2010.02123.x. Epub 2010 Jan 29. Plant Cell Environ. 2010. PMID: 20132521
-
Ethylene insensitivity modulates ozone-induced cell death in birch.Plant Physiol. 2003 May;132(1):185-95. doi: 10.1104/pp.102.018887. Plant Physiol. 2003. PMID: 12746524 Free PMC article.
-
UPBEAT1-ROS-POD-PAL System under Different Xylogenesis Scenarios in Karelian Birch (Betula pendula Roth var. carelica (Mercl.) Hämet-Ahti).Protein Pept Lett. 2024;31(5):375-385. doi: 10.2174/0109298665291781240529044444. Protein Pept Lett. 2024. PMID: 38840406
-
Northern environment predisposes birches to ozone damage.Plant Biol (Stuttg). 2007 Mar;9(2):191-6. doi: 10.1055/s-2006-924176. Epub 2006 Jul 24. Plant Biol (Stuttg). 2007. PMID: 16865657 Review.
-
Hydrogen peroxide and nitric oxide as signalling molecules in plants.J Exp Bot. 2002 May;53(372):1237-47. J Exp Bot. 2002. PMID: 11997372 Review.
Cited by
-
Graft union formation in tomato plants: peroxidase and catalase involvement.Ann Bot. 2004 Jan;93(1):53-60. doi: 10.1093/aob/mch014. Epub 2003 Nov 20. Ann Bot. 2004. PMID: 14630693 Free PMC article.
-
A mechanistic insight into hydrogen peroxide-mediated elicitation of bioactive xanthones in Hoppea fastigiata shoot cultures.Planta. 2016 Jul;244(1):259-74. doi: 10.1007/s00425-016-2506-6. Epub 2016 Apr 8. Planta. 2016. PMID: 27059029
-
Wound-induced oxidative responses in mountain birch leaves.Ann Bot. 2006 Jan;97(1):29-37. doi: 10.1093/aob/mcj005. Epub 2005 Oct 27. Ann Bot. 2006. PMID: 16254021 Free PMC article.
-
Effects of feeding Spodoptera littoralis on lima bean leaves. I. Membrane potentials, intracellular calcium variations, oral secretions, and regurgitate components.Plant Physiol. 2004 Apr;134(4):1752-62. doi: 10.1104/pp.103.034165. Epub 2004 Mar 29. Plant Physiol. 2004. PMID: 15051862 Free PMC article.
-
Effect of various abiotic stressors on some biochemical indices of Lepidium sativum plants.Sci Rep. 2020 Dec 3;10(1):21131. doi: 10.1038/s41598-020-78330-1. Sci Rep. 2020. PMID: 33273699 Free PMC article.
References
-
- Alvarez ME, Pennell RI, Meijer P-J, Ishikawa A, Dixon RA, Lamb C. Reactive oxygen intermediates mediate a systemic signal network in the establishment of plant immunity. Cell. 1998;92:773–784. - PubMed
-
- Bi Y-M, Kenton P, Mur L, Darby R, Draper J. Hydrogen peroxide does not function downstream of salicylic acid in the induction of PR protein expression. Plant J. 1995;8:235–245. - PubMed
-
- Bolwell GP. Role of active oxygen species and NO in plant defense responses. Curr Opin Plant Biol. 1999;2:287–294. - PubMed
-
- Bolwell GP, Wojtaszek P. Mechanisms for the generation of reactive oxygen species in plant defence: a broad perspective. Physiol Mol Plant Pathol. 1997;51:347–366.
Publication types
MeSH terms
Substances
LinkOut - more resources
Full Text Sources
