. 2002 Oct;130(2):577-90.
doi: 10.1104/pp.009175.

Expression profiling of the whole Arabidopsis shaggy-like kinase multigene family by real-time reverse transcriptase-polymerase chain reaction

Affiliations

Expression profiling of the whole Arabidopsis shaggy-like kinase multigene family by real-time reverse transcriptase-polymerase chain reaction

Bénédicte Charrier et al. Plant Physiol. 2002 Oct.

Abstract

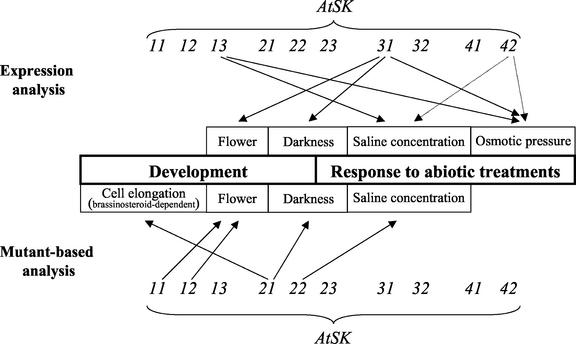
The recent publication of the complete sequence of the Arabidopsis genome allowed us to identify and characterize the last two members of the SHAGGY-like kinase (AtSK) gene family. As a result, the study of the overall spatio-temporal organization of the whole AtSK family in Arabidopsis has become an achievable and necessary aim to understand the role of each SHAGGY-like kinase during plant development. An analysis of the transcript level of the 10 members of the family has been performed using the technique of real-time quantitative reverse transcriptase-polymerase chain reaction. Transcript levels in several organs, under different growth conditions, were analyzed. To calibrate the results obtained, a number of other genes, such as those coding for the two MAP3Kepsilons and the two MAP4Kalphas, as well as the stress response marker RD29A; the small subunit of the Rubisco photosynthetic enzyme Ats1A; the MEDEA chromatin remodeling factor; and the SCARECROW, ASYMMETRIC LEAVES 1, and SUPERMAN transcription factors all involved in key steps of plant development were used. The analysis of our data revealed that eight of the 10 genes of the AtSK family displayed a pseudo-constitutive expression pattern at the organ level. Conversely, AtSK13 responded to osmotic changes and saline treatment, whereas AtSK31 was flower specific and responded to osmotic changes and darkness.


Figures

Figure 1
Figure 1
Relationship tree based on the catalytic domain of the Arabidopsis Ser/Thr protein kinases. The sequence-based relationship between AtSK, AtMAP3K, and AtMAP4K, compared with the other groups of S/T kinases, is presented in the tree. In bold are indicated the major groups of S/T kinases, i.e. the receptor-like kinases (RLK) and the RAF kinases (standard characters), as well as the non-receptor S/T kinases, such as CMGC, AGC, CaMK, and STE (comic characters), as defined by Hunter and Plowman (1997). The 10 AtSK genes, the two AtMAP3Kεs, and the two AtMAP4Kαs are typed in bold small characters. The distance tree was constructed using the neighbor-joining method (Saitou and Nei, 1987) via the ClustalX program. We rooted the tree using the sequences of Arabidopsis RLK. The tree, including 52 RAF and 316 non-receptor S/T kinases, has been simplified. The bootstrap values of 100 replicates are only indicated for the AtSK, the AtMAP3Kε, and the AtMAP4Kα proteins.
Figure 2
Figure 2
Range of the absolute steady-state transcript levels for the 21 genes tested. Genes were tested for their steady-state transcript level in eight different organs and seven different growth conditions. The y axis is a log10 representation of the number of ge per nanogram of total RNA (ge ng RNA−1). The four AtSK gene subgroups are represented as vertical boxes. Subgroups 1 and 2 are both represented by the same box. For the other genes, the results are presented as a bar spreading from the highest to the lowest levels observed, with an arrowhead representing the average level. They are organized in descending order from the gene presenting the highest level (Ats1A), to the gene presenting the lowest level (SUP).
Figure 3
Figure 3
Relative expression profile of the 10 AtSK genes compared with 10 reference genes in Arabidopsis organs. The transcript level is represented as a ratio (R) of the absolute value of the studied gene to the absolute value of the ACT2/ACT8 genes. Due to the ratio calculation, the sds are not represented on this figure. The transcript levels have been tested on RNA extracted from roots (R), rosette leaves (RL), cauline leaves (CL), inflorescence stems (IS), flower buds (FB), open flowers (OF), siliques (SI), and seedlings (S). A, Distribution of AtSK transcripts. B, Distribution of the AtMAP3Kε and AtMAP4Kα transcripts. C, Distribution of Ats1A and RD29A transcripts. Two scales are provided on the y axis, each with the color of the corresponding gene. D, Distribution of SUP, MEA, AS1, and SCR transcripts. Like in C, two scales are provided with colors matching the genes.
Figure 4
Figure 4
Relative expression profile of the 10 AtSK genes compared with 10 reference genes in plants undergoing abiotic treatments. Only the results obtained for four treatments (NaCl, PEG, dark, and wounding) of the seven performed in this study are presented. The transcript level is represented as log2 of R′. R′ is defined as the ratio of the Rn value of the studied gene (R = absolute value of the gene/absolute value of ACT2/ACT8−1) at the time Tn, to the R0 value of the same gene at the time T0. The scale is presented in the left margin, whereas the kinetics timepoints are indicated in the right margin. Due to the ratio calculation, the sds are not represented in this figure. The transcriptional response of the 10 AtSK genes is separated from the other 10 reference genes by a vertical bar.
Figure 5
Figure 5
Summary of the involvement of the AtSK genes in biological processes. The biological processes, which the AtSK genes are involved in, are indicated in boxes in the center of the figure. Each of the AtSK genes is represented above and under the boxes. The arrows indicate that the genes are involved in the indicating biological processes. The bottom one-half of the figure refers to previous studies based on the analysis of mutants or transgenic plants. The top one-half of the figure refers to this study, based on the analysis of the expression pattern of the AtSK genes. The dashed arrows concern slight modifications of the expression level.

Similar articles

Cited by

References

    1. Amador V, Monte E, Garcia-Martinez JL, Prat S. Gibberellins signal nuclear import of PHOR1 a photoperiod-responsive protein with homology to Drosophilaarmadillo. Cell. 2001;106:343–354. - PubMed
    1. An YQ, McDowell JM, Huang S, McKinney EC, Chambliss S, Meagher RB. Strong, constitutive expression of the Arabidopsis ACT2/ACT8actin subclass in vegetative tissues. Plant J. 1996;10:107–121. - PubMed
    1. Bustin SA. Absolute quantification of mRNA using real-time reverse transcription polymerase chain reaction assays. J Mol Endocrinol. 2000;25:169–193. - PubMed
    1. Byrne ME, Barley R, Curtis M, Arroyo JM, Dunham M, Hudson A, Martienssen RA. ASYMMETRIC LEAVES 1 mediates leaf patterning and stem cell function in Arabidopsis. Nature. 2000;408:967–971. - PubMed
    1. Chikano H, Ogawa M, Ikeda Y, Koizumi N, Kusano T, Sano H. Two novel genes encoding SNF-1 related protein kinases from Arabidopsis thaliana: differential accumulation of AtSR1 and AtSR2transcripts in response to cytokinins and sugars and phosphorylation of sucrose synthase by AtSR2. Mol Gen Genet. 2001;264:674–681. - PubMed

MeSH terms