Comparative Study
. 2002 Oct;130(2):964-76.
doi: 10.1104/pp.008201.

Bundle sheath diffusive resistance to CO(2) and effectiveness of C(4) photosynthesis and refixation of photorespired CO(2) in a C(4) cycle mutant and wild-type Amaranthus edulis

Affiliations
Comparative Study

Bundle sheath diffusive resistance to CO(2) and effectiveness of C(4) photosynthesis and refixation of photorespired CO(2) in a C(4) cycle mutant and wild-type Amaranthus edulis

Olavi Kiirats et al. Plant Physiol. 2002 Oct.

Erratum in

  • Plant Physiol. 2003 May;132(1):400

Abstract

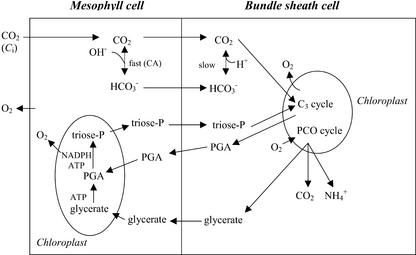
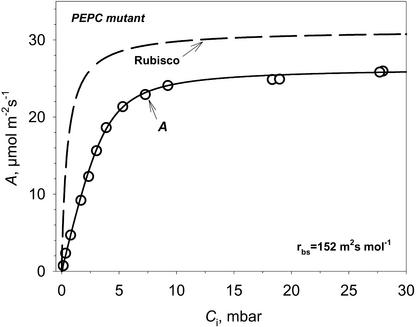
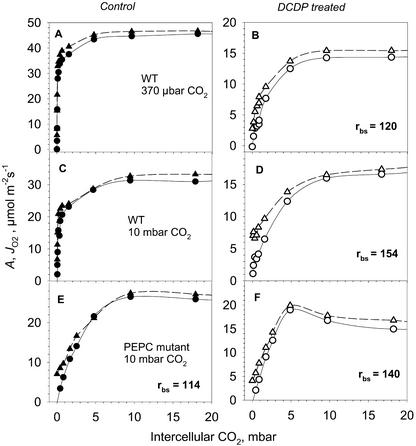
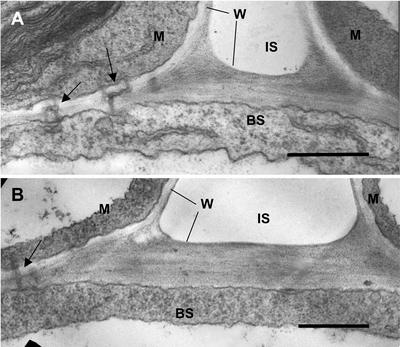
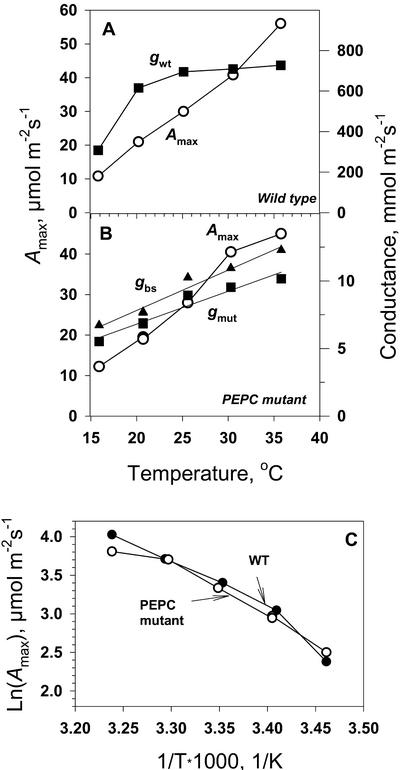
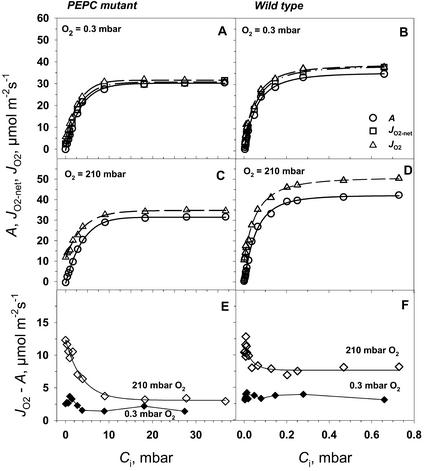
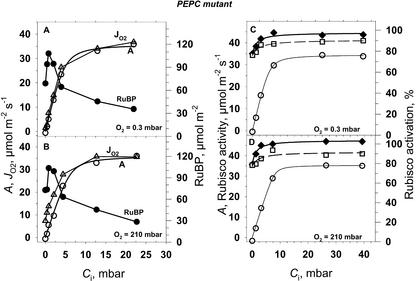
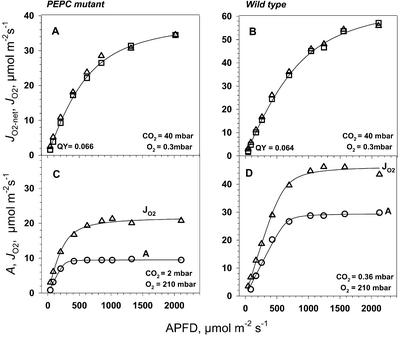
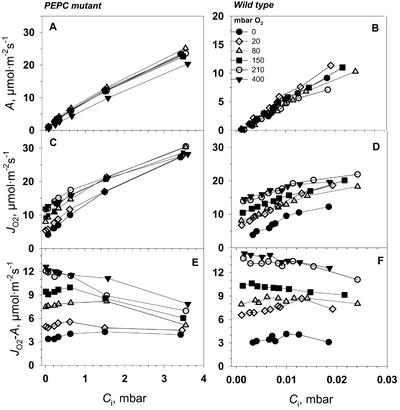
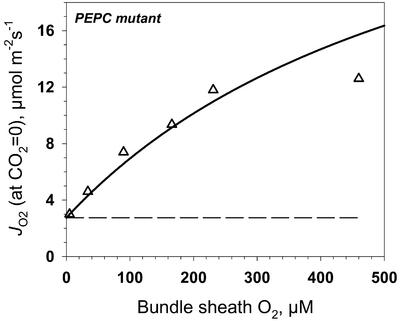
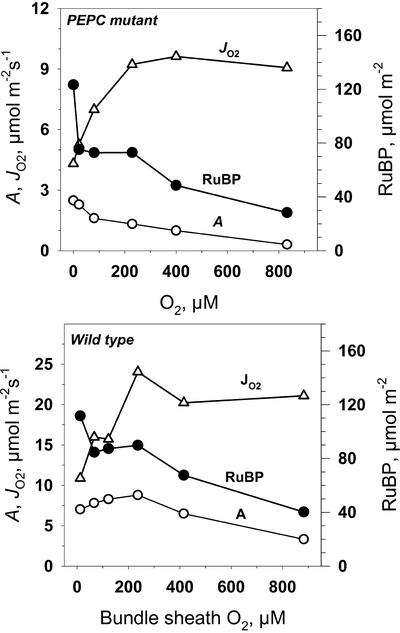
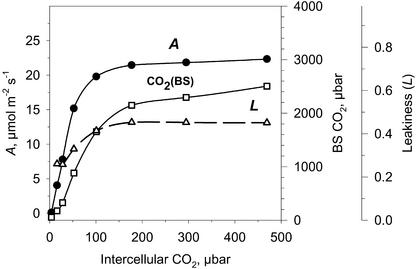
A mutant of the NAD-malic enzyme-type C(4) plant, Amaranthus edulis, which lacks phosphoenolpyruvate carboxylase (PEPC) in the mesophyll cells was studied. Analysis of CO(2) response curves of photosynthesis of the mutant, which has normal Kranz anatomy but lacks a functional C(4) cycle, provided a direct means of determining the liquid phase-diffusive resistance of atmospheric CO(2) to sites of ribulose 1,5-bisphosphate carboxylation inside bundle sheath (BS) chloroplasts (r(bs)) within intact plants. Comparisons were made with excised shoots of wild-type plants fed 3,3-dichloro-2-(dihydroxyphosphinoyl-methyl)-propenoate, an inhibitor of PEPC. Values of r(bs) in A. edulis were 70 to 180 m(2) s(-1) mol(-1), increasing as the leaf matured. This is about 70-fold higher than the liquid phase resistance for diffusion of CO(2) to Rubisco in mesophyll cells of C(3) plants. The values of r(bs) in A. edulis are sufficient for C(4) photosynthesis to elevate CO(2) in BS cells and to minimize photorespiration. The calculated CO(2) concentration in BS cells, which is dependent on input of r(bs), was about 2,000 microbar under maximum rates of CO(2) fixation, which is about six times the ambient level of CO(2). High re-assimilation of photorespired CO(2) was demonstrated in both mutant and wild-type plants at limiting CO(2) concentrations, which can be explained by high r(bs). Increasing O(2) from near zero up to ambient levels under low CO(2), resulted in an increase in the gross rate of O(2) evolution measured by chlorophyll fluorescence analysis in the PEPC mutant; this increase was simulated from a Rubisco kinetic model, which indicates effective refixation of photorespired CO(2) in BS cells.


Figures

Figure 1
Figure 1
Schematic representation of the movement of gases and metabolites in the PEPC mutant of A. edulis. CO2 diffuses into BS cell chloroplasts where it enters the C3 cycle. Equilibrium between HCO3 and CO2 in mesophyll cell is fast, but it is slow in BS because of lack of carbonic anhydrase activity. Glycerate, ammonia, and CO2 are generated by the photosynthetic carbon oxidation (PCO) cycle. Glycerate metabolism and partial reduction of PGA in mesophyll cells may account for use of some photochemically generated energy in mesophyll chloroplasts.
Figure 2
Figure 2
Example of calculating BS cell resistance from A versus Ci curves measured at low O2 (0.3 mbar) and PFD of 1,800 μmol m−2 s−1 in PEPC mutant. The inverse of the initial slope of A/Ci curve is the sum of the diffusive resistance from the cell wall to the sites of Rubisco and of the chemical RuBP carboxylation resistance. A simulated Rubisco CO2 response curve without diffusive resistance is shown for comparison. Rubisco resistance can be calculated as Kc/Vc. Vc was taken as Amax.
Figure 3
Figure 3
The response of the rates of CO2 assimilation (A, ○, ●) and gross rate of O2 evolution from PSII (JO2, ▴, ▵) on wild type and PEPC mutant with and without feeding DCDP. Measurements were made on leaves of excised plants under 20 mbar O2. The calculated values of rbs in wild-type plants in presence of DCDP and in PEPC mutant with and without DCDP are shown. A and B, Wild-type plants grown at 370 μbar CO2; C and D, wild-type plants grown at 10 mbar CO2; E and F, PEPC mutant grown at 10 mbar CO2.
Figure 4
Figure 4
Electron microscopy showing cross sections through interface of mesophyll and BS of leaves of wild type (A) and PEPC mutant (B) with plants grown at 10 mbar CO2. M, Part of mesophyll cell; BS, part of BS cell; W, cell wall; IS, intercellular air space. Arrows point to plasmodesmata. Scale bar = 0.5 μm. The average thickness of BS cell wall in contact with intercellular air from several sections was 0.34 μm for wild type and 0.32 μm for mutant (n = 3).
Figure 5
Figure 5
Temperature dependence of photosynthetic parameters for wild-type (A) and PEPC mutant (B) A. edulis measured under 0.3 mbar O2. Shown are internal conductance in the mesophyll for wild type, gwt (the initial slope of A/Ci curves), the internal conductance in the mutant, gmut, and the calculated liquid phase-diffusive conductance in the mutant (gbs) and maximal CO2 assimilation rate (Amax). C has Amax from A and B plotted in Arrhenius axes (the slope equals −Ea/R). Values of JO2-net measured under saturating CO2 (data not shown) were similar to values of Amax.
Figure 6
Figure 6
The response of the rates of CO2 assimilation (A, ○), net O2 evolution (JO2-net, □), and gross O2 evolution from PSII (JO2, ▵) in PEPC mutant and wild-type A. edulis to intercellular CO2 (Ci) at two oxygen partial pressures, 210 and 0.3 mbar. The CO2 response curves were measured at PFD = 1,800 μmol m−2 s−1 and at leaf temperature 29°C.
Figure 7
Figure 7
CO2 response for CO2 assimilation rate (A, ○), gross O2 evolution rate (JO2, ▵), RuBP pool size (●), Rubisco activity (⧫), and Rubisco activation state (□) for PEPC mutant A. edulis at two O2 pressures, 0.3 and 210 mbar. Leaf temperature was 28°C, PFD = 1,400 μmol m−2 s−1. Each point is from a different leaf of similar age.
Figure 8
Figure 8
Light response of PEPC mutant and wild-type A. edulis O2 evolution (JO2-net, □) at highly saturating levels of CO2 of 40 mbar CO2 (O2 = 0.3 mbar), and CO2 uptake (A, ○) at limiting CO2 (2 mbar for PEPC mutant and 0.36 mbar for wild type) and 210 mbar O2 pressure. Leaf temperature was 28°C. Gross rates of O2 evolution (JO2, Δ) were calculated from simultaneous fluorescence measurements as described in “Materials and Methods.”
Figure 9
Figure 9
Oxygen sensitivity of A. edulis photosynthesis at limiting CO2 concentrations, 30°C, and PFD = 1,800 μmol m−2 s−1. The rate of PSII O2 evolution (JO2) shows an increase with increasing O2 concentration and continues at CO2 = 0 because of re-assimilation of CO2 released from the photorespiration and from the Krebs cycle.
Figure 10
Figure 10
JO2 for the PEPC mutant of A. edulis from Figure 9 was extrapolated to CO2 = 0, and the results were plotted against O2 concentration. The simulated JO2 shown by the solid line was calculated based on BS O2 and CO2 concentration (the latter calculated for each O2 level considering BS-diffusive resistance) and Rubisco kinetic constants (Vc = 39, Kc = 21 μm, and Ko = 640 μm), where JO2 equals vc + vo (Edwards and Baker, 1993). The rate of CO2 re-assimilation (at zero external CO2) is proportional to the ratio of Rubisco conductance and BS-diffusive conductance.
Figure 11
Figure 11
PEPC mutant and wild-type A. edulis leaf RuBP content (●) versus O2 concentration with Ci of 0.4 mbar for mutant and 0.025 mbar for wild type. Also, CO2 assimilation rate (A, ○) and O2 evolution from PSII (JO2, ▵) are shown. Leaf temperature was 28°C; light PFD = 1,800 μmol m−2 s−1.
Figure 12
Figure 12
CO2 response for CO2 assimilation rate (at leaf temperature of 28°C; PFD = 1,800 μmol m−2s−1; ●), calculated CO2 partial pressure in BS cells (□), and leakiness of CO2 from BS cells (▵). The CO2 level in BS cells was calculated according to von Caemmerer (2000), and the leakiness was calculated according to equations 16 and 17 using rbs value of 113 m2 s−1 mol−1. Similar results were obtained from analysis of several experiments on A/Ci responses.

Similar articles

Cited by

References

    1. Brown RH. Analysis of bundle sheath conductance and C4 photosynthesis using a PEP-carboxylase inhibitor. Aust J Plant Physiol. 1997;24:549–554.
    1. Brown RH, Byrd GT. Estimation of bundle sheath cell conductance in C4 species and O2 insensitivity of photosynthesis. Plant Physiol. 1993;103:1183–1188. - PMC - PubMed
    1. Canvin DT, Berry JA, Badger MR, Fock H, Osmond CB. Oxygen exchange in leaves in the light. Plant Physiol 66: 302–307 concentrating mechanism and photorespiration. Plant Physiol. 1980;103:83–90. - PMC - PubMed
    1. Dever LV, Blackwell RD, Fullwood NJ, Lacuesta M, Leegood RC, Onek LA, Pearson M, Lea PJ. The isolation and characterization of mutants of the C4 photosynthetic pathway. J Exp Bot. 1995;46:1363–1376.
    1. Edwards GE, Baker NR. Can CO2 assimilation in maize leaves be predicted accurately from chlorophyll fluorescence analysis? Photosynth Res. 1993;37:89–102. - PubMed

Publication types

MeSH terms

Substances

LinkOut - more resources