. 2002 Oct 14;159(1):181-9.
doi: 10.1083/jcb.200206089. Epub 2002 Oct 14.

Cytosolic free Ca(2+) changes and calpain activation are required for beta integrin-accelerated phagocytosis by human neutrophils

Affiliations

Cytosolic free Ca(2+) changes and calpain activation are required for beta integrin-accelerated phagocytosis by human neutrophils

Sharon Dewitt et al. J Cell Biol. .

Abstract

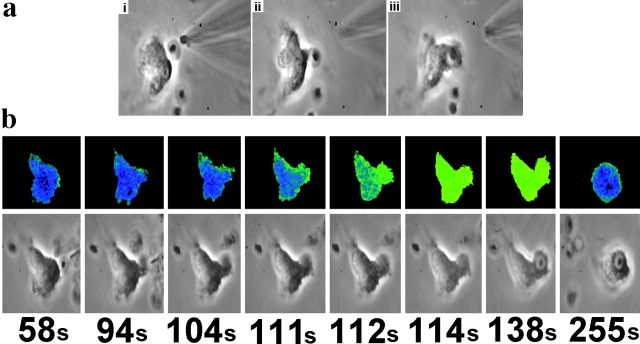
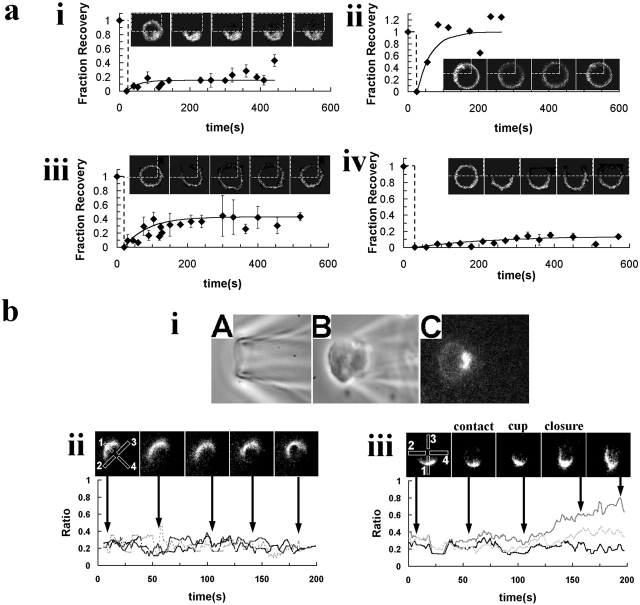
Phagocytosis of microbes coated with opsonins such as the complement component C3bi is the key activity of neutrophils. However, the mechanism by which opsonins enhance the rate of phagocytosis by these cells is unknown and has been difficult to study, partly because of the problem of observing and quantifying the events associated with phagocytosis. In this study, C3bi-opsonized particles were presented to neutrophils with a micromanipulator, so that the events of binding, pseudopod cup formation, engulfment, and completion of phagocytosis were clearly defined and distinguished from those involved with chemotaxis. Using this approach in combination with simultaneous phase contrast and Ca(2+) imaging, the temporal relationship between changes in cytosolic free Ca(2+) concentration and phagocytosis were correlated. Here we show that whereas small, localized Ca(2+) changes occur at the site of particle attachment and cup formation as a result of store release, rapid engulfment of the particle required a global change in cytosolic free Ca(2+) which resulted from Ca(2+) influx. This latter rise in cytosolic free Ca(2+) concentration also liberated a fraction of beta2 integrin receptors which were initially immobile on the neutrophil surface, as demonstrable by both fluorescence recovery after laser bleaching and by visualization of localized beta2 integrin labelling. Inhibitors of calpain activation prevented both the Ca(2+)-induced liberation of beta2 integrin and the rapid stage of phagocytosis, despite the persistence of the global Ca(2+) signal. Therefore, we propose that Ca(2+) activation of calpain causes beta2 integrin liberation, and that this signal plays a key role in the acceleration of beta2 integrin-mediated phagocytosis.


Figures

Figure 1.
Figure 1.
Ca 2+ signals accompanying C3bi-mediated phagocytosis. (a) The cytosolic free Ca2+ concentration within an individual neutrophil undergoing phagocytosis is shown. The line graph shows the complete Ca2+ signal, and the images show the neutrophil shape and Ca2+ concentration as pseudocolor at the time points indicated by the arrows. The pseudopodia extension and cup formation on the second image is better seen in the sequence in b, where the initial position of the opsonized particle is marked by the filled white circle in the first three images. The formation of the cup and the localized Ca2+ signal is evident after the third image in the sequence (the filled white circle has not been added to these images so that the localized Ca2+ events can be clearly seen). In both parts of this figure (and in all subsequent figures), the same pseudocolor look-up-table shown has been used and is shown between parts a and b. This cell was typical of 33 out of 36 cells investigated in which Ca2+ changed in response to opsonized phagocytosis. In the three remaining cells, complete phagocytosis was observed without any detectable change in cytosolic free Ca2+ concentration, presumably because phagocytosis proceeded without β2 engagement. The data sequence shown here is also available online at http://www.jcb.org/cgi/content/full/jcb.200206089/DC1.
Figure 2.
Figure 2.
Ca2 + signals induced by C3bi-mediated phagocytosis. (a) The technique of presenting an opsonized particle to an individual neutrophil is shown in the sequence of images where the particle, held by the micropipette, is placed in contact with the neutrophil (i); the micropipette is removed as the particle binds to the neutrophil (ii); and the phagocytic cup forms and phagocytosis proceeds (iii). (b) Selected frames from a sequence of simultaneously acquired Ca2+ and phase contrast images of a neutrophil presented with a C3bi- opsonized zymosan particle. (Top) Ca2+ images according to the look-up-table shown in Fig 1. Localized Ca2+ changes are seen in images at 111 and 112 s, and then the global Ca2+ change in 114 s. (Bottom) Corresponding phase contrast images, superimposed on to which were high Ca2+ pixels (with 30% opacity); in order to demonstrate the correlation between cup formation and localized small Ca2+ changes. The relationship between the triggered Ca2+ signal and (c) the rate of spreading of the pseudopodia over the surface of the zymosan particle (length of cell:particle contact) and (d) the accompanying whole-cell morphology change (cell area) derived from a semi-automatic adaptive spline tracking program are shown. The Ca2+ and morphology changes shown here were typical of the majority (70%) of experiments performed. In the remaining cells, the Ca2+ response had a distinctive double peak (Fig. 5 f).
Figure 2.
Figure 2.
Ca2 + signals induced by C3bi-mediated phagocytosis. (a) The technique of presenting an opsonized particle to an individual neutrophil is shown in the sequence of images where the particle, held by the micropipette, is placed in contact with the neutrophil (i); the micropipette is removed as the particle binds to the neutrophil (ii); and the phagocytic cup forms and phagocytosis proceeds (iii). (b) Selected frames from a sequence of simultaneously acquired Ca2+ and phase contrast images of a neutrophil presented with a C3bi- opsonized zymosan particle. (Top) Ca2+ images according to the look-up-table shown in Fig 1. Localized Ca2+ changes are seen in images at 111 and 112 s, and then the global Ca2+ change in 114 s. (Bottom) Corresponding phase contrast images, superimposed on to which were high Ca2+ pixels (with 30% opacity); in order to demonstrate the correlation between cup formation and localized small Ca2+ changes. The relationship between the triggered Ca2+ signal and (c) the rate of spreading of the pseudopodia over the surface of the zymosan particle (length of cell:particle contact) and (d) the accompanying whole-cell morphology change (cell area) derived from a semi-automatic adaptive spline tracking program are shown. The Ca2+ and morphology changes shown here were typical of the majority (70%) of experiments performed. In the remaining cells, the Ca2+ response had a distinctive double peak (Fig. 5 f).
Figure 3.
Figure 3.
The Ca2 + signal decreased with each successive phagocytic event. The line graph shows the Ca2+ changes provoked by successive phagocytic events by the same neutrophil. For each event, (labeled “uptake 1–3”), three phase contrast and Ca2+ images are shown at particle binding, peak Ca2+ and completion. Each event was allowed to run to completion, Ca2+ return to resting level and normal motile morphology reestablished (after pseudopod retraction and cell rounding) before the next particle was presented to the cell. The experiment was typical of at least five others.
Figure 4.
Figure 4.
Neutrophils signal Ca2 + and complete C3bi-mediated phagocytosis when presented with particles at sites remote from their leading edge. Two series of simultaneously acquired phase contrast and Ca2+ images are shown with the time of acquisition shown. (a) A neutrophil is shown which was undergoing chemokinesis in the direction shown by the red arrow on the phase contrast images. A C3bi-opsonized particle was presented to the cell in ii at the location indicated by the white cross on the phase contrast image. (iii) Binding has occurred. (iv) The phagocytic cup has formed. (v) Ca2+ response and rapid engulfment phase. (vi) Completion of phagocytosis and restoration of resting cytosolic free Ca2+ concentration. The complete dataset from which this data is taken is shown as Video 2 (available online at http://www.jcb.org/cgi/content/full/jcb.200206089/DC1) with the resultant Ca2+ measurement. (b) A neutrophil was presented with a particle but removed to leave an abortive phagocytic cup, as indicated by the red arrow on the phase contrast image. The particle was then placed in the position indicated by the white cross. A localized Ca2+ signal is seen at the point of particle contact (ii) before the global Ca2+ rises in images (iii) and (iv) and the abortive phagocytic cup retracts in image (v) and the cell assumes a round morphology and resting cytosolic free Ca2+ concentration (vi).
Figure 5.
Figure 5.
Pharmacological inhibition of C3bi-mediated Ca2 + signaling The line graphs show Ca2 + changes in response to C3bi-mediated phagocytosis in the presence of inhibitor or control as indicated by the shaded bar. (a–c) The effect of a single phagocytic challenge in the presence of inhibitor or control. (d–f) The Ca2+ changes which resulted from two phagocytic challenges, with the inhibitor present only for the second phagocytic event. In all traces, the time to complete phagocytosis (tphag) is shown and the points of particle cell contact and phagosome closure indicated by an arrow and an asterisk respectively. In traces a and d, no inhibitor was present. (b and e) The shaded bars indicate the presence of NiCl2 (1 mM). (c and f) The cell was incubated with LY294002 (50 μM, 5 min, 37°C) before the period indicated by the shaded bar. These data are representative of at least nine replicate experiments on neutrophils from different donors.
Figure 6.
Figure 6.
The Ca2 + signal is not a consequence of cell shape change. The panel shows simultaneously acquired phase contrast and Ca2+ images. The neutrophil was shown to be phagocytically competent by presentation of a particle which was internalized by the cell and is indicated in the first image by the red arrow. The cell was then treated with cytochalasin B (5 μg/ml) to inhibit actin-dependent cell shape changes, and a second particle presented to the cell. Although the neutrophil was unable to form a phagocytic cup or display any morphological change, the Ca2+ signal associated with C3bi signaling remained, as can be seen in images 45–51 s.
Figure 8.
Figure 8.
Calpain inhibition reduces phagocytosis without interfering with Ca2 + signaling. (a) Populations of neutrophils were incubated at 37°C with C3bi-opsonized zymosan particles for 10, 30, and 60 min, before being fixed, stained, and phagocytosis quantified. The histograms show the mean and standard errors for the number of particles/cell internalized by at least 100 neutrophils from separate donors (n value). Data is shown for untreated neutrophils (control, n = 11), those treated with the calpain inhibitor PD150606 (50 μM,15 min, n = 7), untreated neutrophils in the absence of extracellular Ca2+ (1 mM EGTA; Ca2+ free, n = 4), those treated with the calpain inhibitor PD150606 (50 μM, 15 min) and then phagocytosis performed in the absence of extracellular Ca2+ (Ca2+ free, PD150606, n = 4), and untreated neutrophils in the presence of extracellular Ca2+ and Ni2+ (1 mM; Ni2+, n = 2). The asterisks indicate significant difference where * is P < 0.05, ** is P < 0.01, and *** is P < 0.001 compared with untreated control. (b) A typical experiment is shown in which a neutrophil treated with the calpain inhibitor calpeptin (100 mg/ml, 15 min, 37°C) was presented with an opsonized zymosan particle. (i) The series of images show the neutrophil morphology changes with high cytosolic free Ca2+ pixels overlain. (a) Presentation of the particle, indicated by red arrow, provokes a loose binding (b) and phagocytic cup forms (c), but fails to progress so that on release of the particle from the micropipette, the particle is not bound to the cell (d, red arrow). The cytosolic free Ca2+ signal is triggered and the cytoplasm of the neutrophil moves toward the region of the abortive cup (e), but the particle has not been internalized and is visible outside the cell (red arrow). (ii) The complete Ca2+ signal is shown with the points at which contact was made and the phagocytic event aborted indicated by the arrows.
Figure 7.
Figure 7.
Changes in the mobility of β2 integrin with Ca2 + and phagocytosis. (a) Neutrophils were labeled with phycoerythrin-labeled anti-CD11b antibody for confocal imaging. A confocal plane was chosen which approximately bisected the cell and the mobility of β2 integrin determined after localized photobleaching. (i–iv) The insert shows the image of a representative cell before localized laser bleaching, with the area to be photobleached marked. The subsequent images show the immediate effect of laser bleaching, followed by three images showing the recovery and equilibrium state. The graphs show the recovery of fluorescence in the bleached area over time as a fraction of the unbleached area. The mean and standard deviations are shown (n = 4–7), for data from neutrophils with (i) resting Ca2+ (∼0.1 μM); (ii) high Ca2+ (>5 μM) elevated by ionomycin (4 μM plus 13 mM extracellular Ca2+); (iii) elevated cytosolic Ca2+, ∼0.8–1 μM induced by ionomycin (4 μM); and (iv) elevated cytosolic Ca2+ (∼0.8–1 μM as in iii) after preincubated with an inhibitor of calpain activation, PD150606 (50 μM, 15 min). (b) Localized labeling of β2 integrin was achieved by use of wide-mouthed micropipettes (tip diameter, 5–10 μm), loaded with stock fluorescent (RPE) antibody to CD11b receptor, shown in i A. The micropipette was moved into contact with a cell and slight negative pressure applied to form a seal between tip and cell i B. After 10–30 s, zero pressure was restored and the tip gently taken away, leaving the region of membrane in contact with the pipette contents, fluorescently labeled i C . (ii and iii) A series of images from part-labeled neutrophils at the time indicated by the arrows. The graphs show the ratio of fluorescence in the unlabeled regions (marked 2–4 on the images) with the labeled region (marked 1). The data for a resting neutrophil is shown in ii. (iii) Data is shown from a neutrophil in which a C3bi-opsonized zymosan particle was brought into contact with the cell (marked “contact”), a phagocytic cup formed (marked “cup”), and phagocytosis continued toward closure. These data were typical of at least three similar experiments.
Figure 9.
Figure 9.
Distribution of β2 integrin in phagocytic cup in calpain-competent and inhibited neutrophils. The distribution of β2 integrin in neutrophils undergoing phagocytosis was determined by pulsing the cell with fluorescent anti-CD18 as the phagocytic cup formed. It was not possible to prelabel β2 integrin as this inhibited phagocytosis by this route, so labeling was performed after engagement of β2 integrin, cup formation and at the time of Ca2+ signaling. (a) A typical untreated neutrophil in which the progression of phagocytosis is shown from (i) binding, (ii) initiation of cup formation, and (iii) cup formation and the point of Ca2+ signaling, at which time fluorescent antibody was pulsed, resulting in the fluorescent image (iv). The position of labeled β2-integrin is shown superimposed on the cell image (ci) to demonstrate β2 integrin near the phagocytic cup available for facilitating phagocytsosis. Panel (b) shows a similar typical experiment in a neutrophil treated with the calpain inhibitor PD150606 (50 μM, 15 min). The images show (i) the neutrophil chosen with an internalized particle, as evidence that it was phagocytically competent before treatment with the inhibitor (ii) binding of two particles and abortive cup formation after inhibition of calpain and (iii) cup formation of the upper particle (and detachment of the lower) and the point of Ca2+ signaling, at which time fluorescent antibody was pulsed, resulting in the fluorescent image (iv). Although labeled β2-integrin was visible over most of the neutrophil surface, the superimposed images (c, ii) reveals that unlike in the uninhibited cells, no β2 integrin was available in either of the two abortive phagocytic cups. These experiments were typical of at least three others.

Similar articles

Cited by

References

    1. Baker, H.L., R.J. Errington, S.C. Davies, and A.K. Campbell. 2002. A mathematical model predicts that calreticulin interacts with the endoplasmic reticulum Ca2+ ATPase. Biophys. J. 82:582–590. - PMC - PubMed
    1. Davies, E.V., and M.B. Hallett. 1999. High micromolar Ca2+ beneath the plasma membrane in stimulated neutrophils. Biochem. Biophys. Res. Commun. 248:679–683. - PubMed
    1. Hallett, M.B., E.V. Davies, and A.K. Campbell. 1990. Oxidase activation in individual neutrophils is dependent on the onset and magnitude of the Ca2+ signal. Cell Calcium. 11:655–663. - PubMed
    1. Hato, T., N. Pampori, and S.J. Shattil. 1998. Complementary roles for receptor clustering and conformational change in the adhesive and signaling functions of integrin alpha(IIb)beta(3). J. Cell Biol. 14:1685–1695. - PMC - PubMed
    1. Hogg, N., and B. Leitinger. 2001. Shape and shift changes related to the function of leukocyte integrins LFA-1 and Mac-1. J. Leukoc. Biol. 69:893–898. - PubMed

Publication types

MeSH terms