. 2002 Oct 29;99(22):14506-11.
doi: 10.1073/pnas.212525299. Epub 2002 Oct 15.

Neural stem cell heterogeneity demonstrated by molecular phenotyping of clonal neurospheres

Affiliations

Neural stem cell heterogeneity demonstrated by molecular phenotyping of clonal neurospheres

Oleg N Suslov et al. Proc Natl Acad Sci U S A. .

Abstract

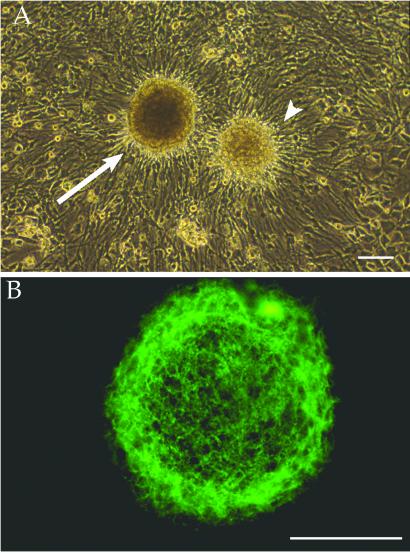
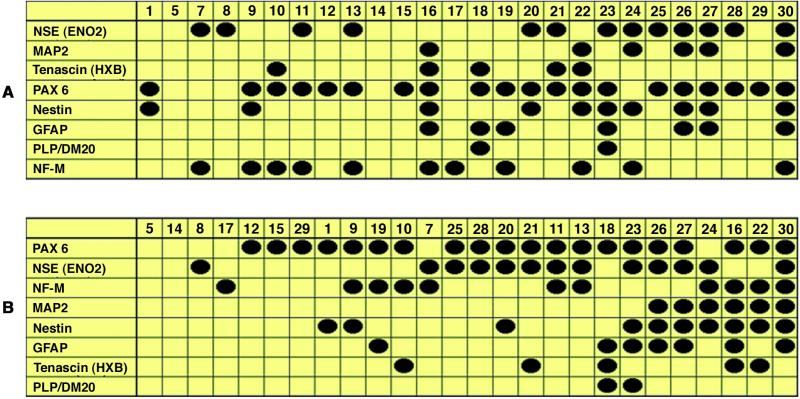
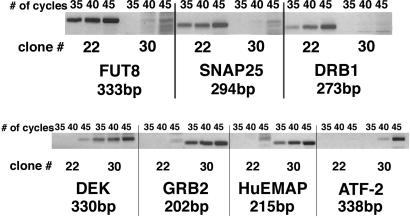
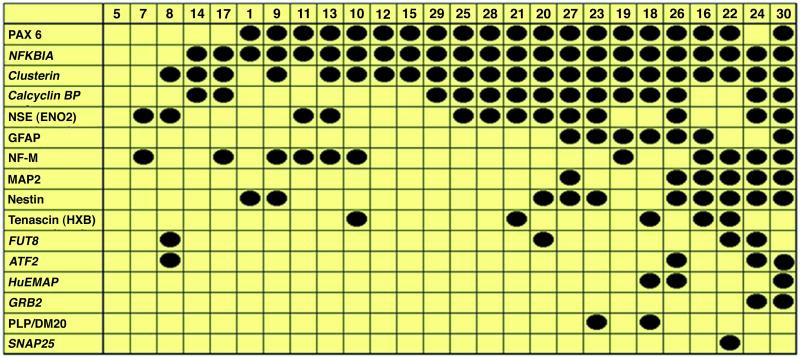
Neural stem cells (NSCs) in vitro are able to generate clonal structures, "neurospheres," that exhibit intra-clonal neural cell-lineage diversity; i.e., they contain, in addition to NSCs, neuronal and glial progenitors in different states of differentiation. The present study focuses on a subset of neurospheres derived from fresh clinical specimens of human brain by using an in vitro system that relies on particular growth factors, serum, and anchorage withdrawal. Thirty individual and exemplary cDNA libraries from these neurosphere clones were clustered and rearranged within a panel after characterization of differentially expressed transcripts. The molecular phenotypes that were obtained indicate that clonogenic NSCs in our in vitro system are heterogeneous, with subsets reflecting distinct neural developmental commitments. This approach is useful for the sorting and expansion of NSCs and facilitates the discovery of genes involved in cell proliferation, communication, fate control, and differentiation.


Figures

Fig 1.
Fig 1.
Phase microscopic (A) and immunofluorescence (B) labeling of representative neurosphere clones. (A) Two neurosphere clones (arrow and arrowhead), generated from NSCs that were plated at the same time from the same brain dissociation and next to each other, show neurosphere heterogeneity. (B) A single neurosphere immunostained for tenascin-C (confirming expression of one of the genes screened for in our cDNA libraries and panel) shows dense expression of this developmentally regulated extracellular matrix protein. (Bars = 100 μm.)
Fig 2.
Fig 2.
Results from screening of 30 human neurosphere cDNA libraries for a representative set of cell phenotype and developmental genes. (A) Nonarranged cDNA panel. (B) cDNA panel rearranged after application of the CLUSTER procedure.
Fig 3.
Fig 3.
Representative results of 22/30 libraries screened and confirmed by relative PCR. FUT8, SNAP25, DRB1 are differentially expressed in clone no. 22; DEK, GRB2, HuEMAP, and ATF2 are differentially expressed in clone no. 30.
Fig 4.
Fig 4.
cDNA panel rearrangement using PCR screening with new transcripts. Transcripts used for second screening (NFKBIA, clusterin, calcyclinBP, FUT8, ATF2, HuEMAP, GRB2, SNAP25) are shown in italics.
Fig 5.
Fig 5.
Hypothetical model for the relationship between neurosphere size and maturation level of clone-forming cells. (A) A row of eight (arbitrary number) cells with varying developmental potential is arranged and color-coded according to presumed maturation level. Five cells within the upright lines can give rise to neurospheres. In this group, the gray cell represents the most immature and the green cell is the most mature clonogenic cell. Three clone-forming cells are depicted (arrowheads); in B and C, alternative architectures of neurospheres are arranged according to the clonogenic potential of the parental cell. (B) In this scenario, the stem cell is less proliferatively active than the progenitor cell. In this model, the most mature (green) cell gives rise to the largest size clone, and the smallest neurosphere contains descendants (e.g., orange and blue cells) from the most immature clonogenic (gray) cell. (C) In this case, the stem cell is more proliferatively active than the progenitor cell. This represents a situation in which the smallest sphere arises from the green neurosphere-forming cell and the largest clone from the more immature gray cell. Both of these simplified models underscore a notion that molecular phenotypic heterogeneity of neurospheres might reflect differences in the developmental potential of distinct stem/progenitor cell groups that co-exist in the brain.

References

    1. McKay R. (1997) Science 276, 66-71. - PubMed
    1. Ray J., Peterson, D. A., Schinstine, M. & Gage, F. H. (1993) Proc. Natl. Acad. Sci. USA 90, 3602-3606. - PMC - PubMed
    1. Reynolds B. A. & Weiss, S. (1992) Science 255, 1707-1710. - PubMed
    1. Weiss S., Dunne, C., Hewson, J., Wohl, C., Wheatley, M., Peterson, A. C. & Reynolds, B. A. (1996) J. Neurosci. 16, 7599-7609. - PMC - PubMed
    1. Kukekov V. G., Laywell, E. D., Thomas, L. B. & Steindler, D. A. (1997) Glia 21, 399-407. - PubMed

Publication types