. 2002 Oct 15;544(2):429-45.
doi: 10.1113/jphysiol.2002.022434.

Dynamic imaging of free cytosolic ATP concentration during fuel sensing by rat hypothalamic neurones: evidence for ATP-independent control of ATP-sensitive K(+) channels

Affiliations

Dynamic imaging of free cytosolic ATP concentration during fuel sensing by rat hypothalamic neurones: evidence for ATP-independent control of ATP-sensitive K(+) channels

Edward K Ainscow et al. J Physiol. .

Abstract

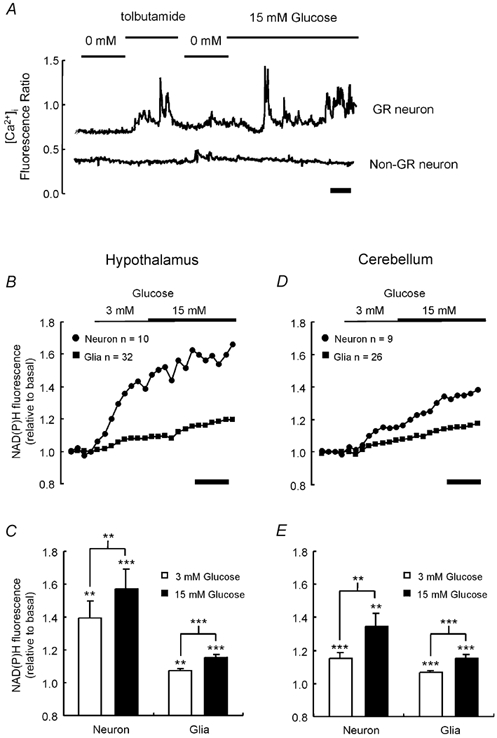
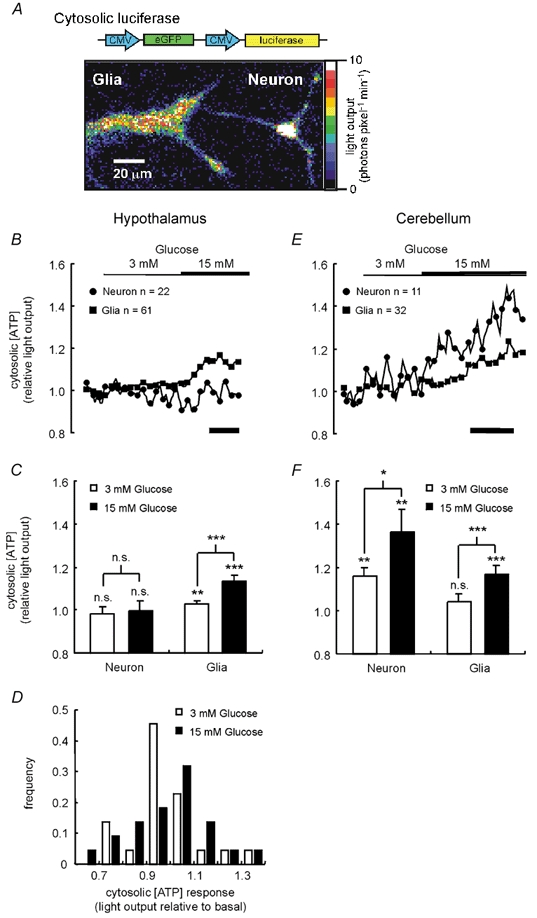
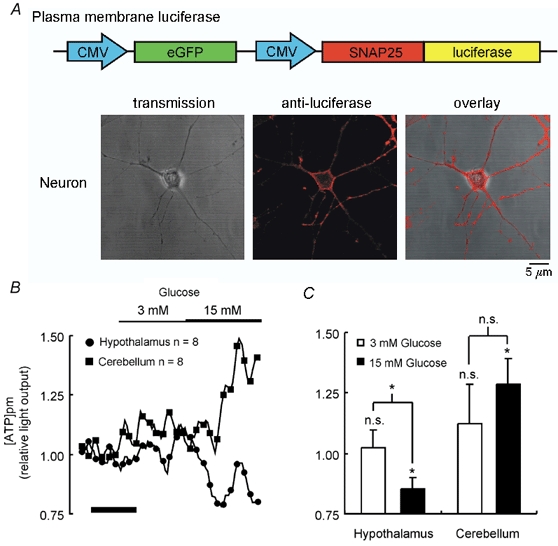
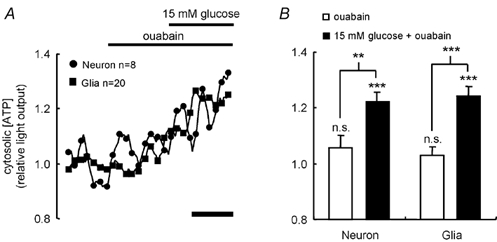
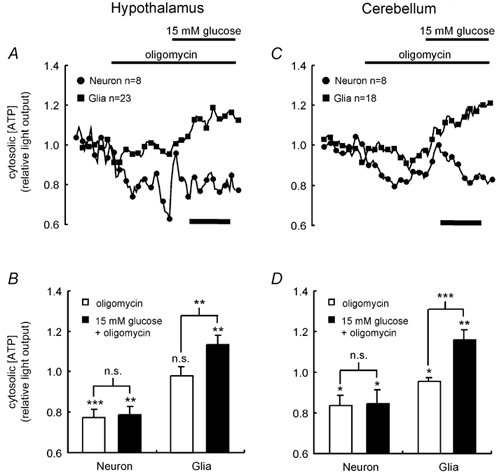
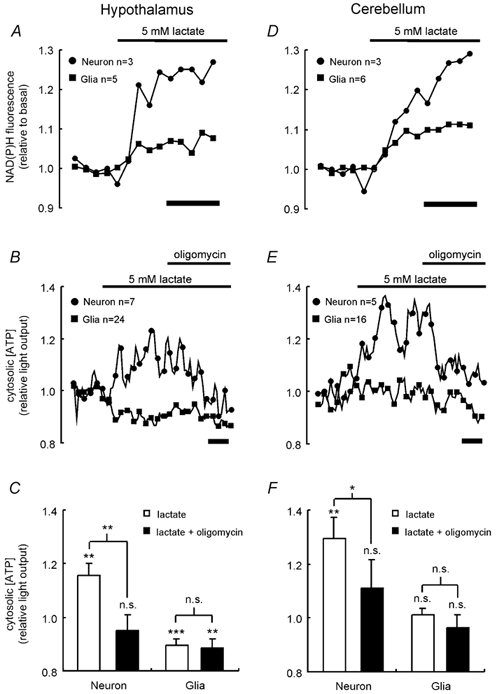
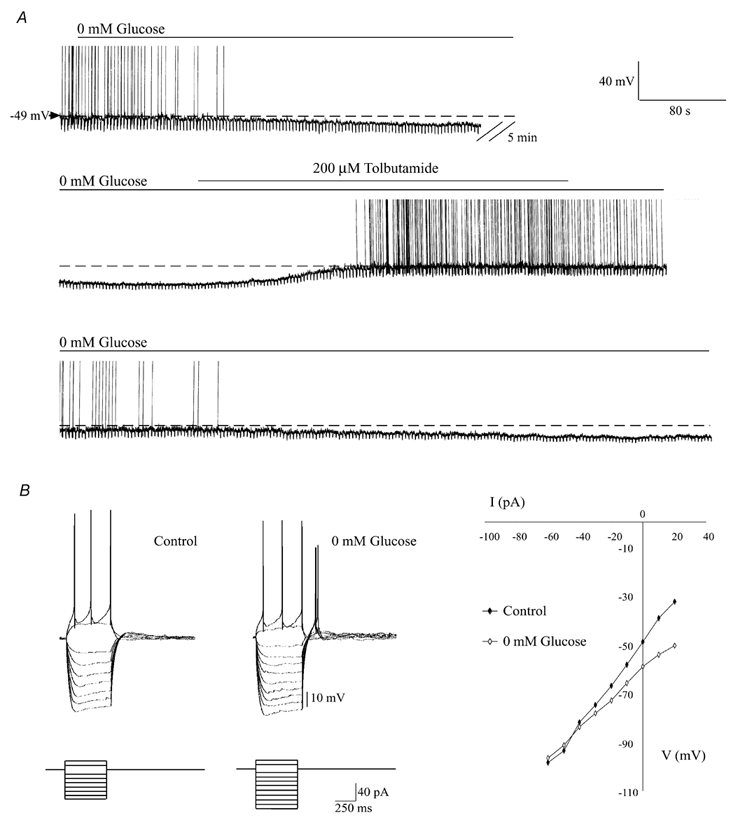
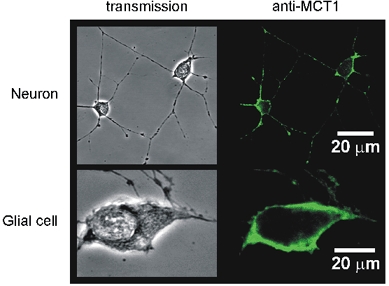
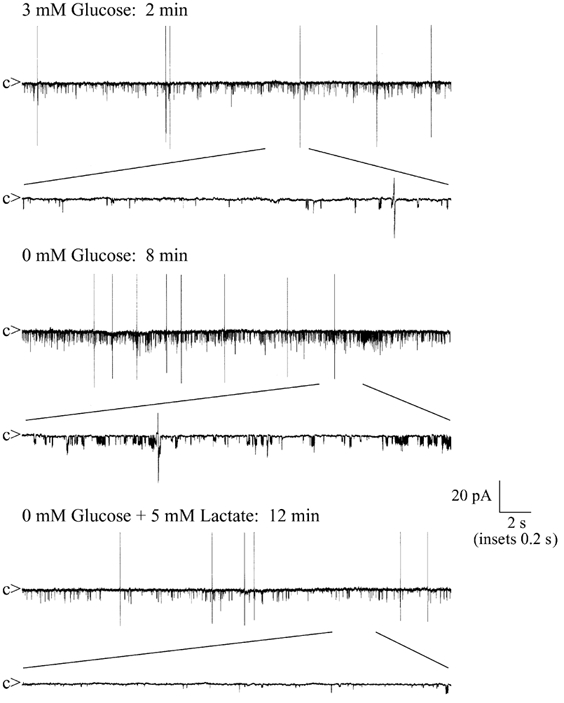
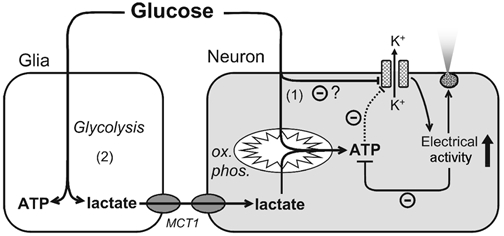
Glucose-responsive (GR) neurons from hypothalamic nuclei are implicated in the regulation of feeding and satiety. To determine the role of intracellular ATP in the closure of ATP-sensitive K(+) (K(ATP)) channels in these cells and associated glia, the cytosolic ATP concentration ([ATP](c)) was monitored in vivo using adenoviral-driven expression of recombinant targeted luciferases and bioluminescence imaging. Arguing against a role for ATP in the closure of K(ATP) channels in GR neurons, glucose (3 or 15 mM) caused no detectable increase in [ATP](c), monitored with cytosolic luciferase, and only a small decrease in the concentration of ATP immediately beneath the plasma membrane, monitored with a SNAP25-luciferase fusion protein. In contrast to hypothalamic neurons, hypothalamic glia responded to glucose (3 and 15 mM) with a significant increase in [ATP](c). Both neurons and glia from the cerebellum, a glucose-unresponsive region of the brain, responded robustly to 3 or 15 mM glucose with increases in [ATP](c). Further implicating an ATP-independent mechanism of K(ATP) channel closure in hypothalamic neurons, removal of extracellular glucose (10 mM) suppressed the electrical activity of GR neurons in the presence of a fixed, high concentration (3 mM) of intracellular ATP. Neurons from both brain regions responded to 5 mM lactate (but not pyruvate) with an oligomycin-sensitive increase in [ATP](c). High levels of the plasma membrane lactate-monocarboxylate transporter, MCT1, were found in both cell types, and exogenous lactate efficiently closed K(ATP) channels in GR neurons. These data suggest that (1) ATP-independent intracellular signalling mechanisms lead to the stimulation of hypothalamic neurons by glucose, and (2) these effects may be potentiated in vivo by the release of lactate from neighbouring glial cells.


Figures

Figure 1
Figure 1. Glucose-induced changes in NAD(P)H fluorescence in neuronal cultures
A, changes in [Ca2+]i were monitored in fura-2-loaded cells, as described in Methods. Tolbutamide (200 μM) and glucose (15 mm) were added as indicated. B-E, changes in cellular autofluorescence, indicative of mitochondrial NAD(P)H concentration, were monitored by confocal microscopy in neurons and glia from hypothalamic (B) and cerebellar (D) neuronal cultures in response to a successive increase in glucose from 0 to 3 to 15 mm. In C and E, the mean ± s.e.m. response of each cell type at greater than 100 s post addition is also given. Significant changes in autofluorescence from basal levels and between additions were assessed using Student's t test; ** P < 0.01; *** P < 0.001. In A, B and D, calibration bars represent 200 s.
Figure 2
Figure 2. Glucose-induced changes in [ATP]c
A, neuronal cultures were infected with virus AdCMVcLuc (Ainscow & Rutter, 2001), bearing cDNA encoding humanised firefly luciferase and eGFP each under a CMV promoter. Successfully infected individual glia and neurons, identified by eGFP expression, could be imaged and their light output, and thus [ATP]c, could be recorded in the presence of 0.5 μM luciferin. Shown is a pseudo-colour image of the light output from cultured hypothalamic cells. B and E, the dynamic response of [ATP]c to stepped increases of [glucose] from 0 to 3 to 15 mm was imaged in neurons and glia isolated from the hypothalamus (B) or the cerebellum (E). Mean values (± s.e.m.) of the responses at time points later than 100 s after each increase in glucose concentration are given in C and F. D, a histogram of the individual responses of the hypothalamic neurons to both glucose concentrations failed to reveal any differential response of a subpopulation of cells. Significant changes from basal light output or differences between the effects of different additions were assessed by Student's t test: n.s., not significant; * P < 0.05; ** P < 0.01; *** P < 0.001. For clarity, in B and E data points are shown only at 60 s intervals. In B and E, calibration bars represent 200 s.
Figure 3
Figure 3. Glucose-induced changes in [ATP]pm in neurons
A, neuronal cultures were infected with adenovirus (AdCMVpmLuc) encoding plasma membrane-targeted luciferase and successful targeting of luciferase to the plasma membrane of neurons was detected by immunocytochemistry using a polyclonal anti-luciferase primary antibody and confocal microscopy (A; see Methods). B, dynamic response of light output and thus [ATP]pm to elevation of [glucose] to 3 and 15 mm monitored in neurons from the hypothalamus and cerebellum. C shows the mean ± s.e.m. response at greater than 100 s post addition. Significant changes in light output from basal levels, and differences between the effects of different additions, were assessed using Student's t test: n.s., not significant; * P < 0.05. In B, the calibration bar represents 200 s.
Figure 4
Figure 4. Presence of ouabain reveals glucose-induced elevation of [ATP]c in hypothalamic neurons
A, the dynamic response of [ATP]c in neurons and glia derived from the hypothalamus was monitored during the successive addition of 0.1 mg ml−1 ouabain and 15 mm glucose, as described in Fig. 2.B shows the average responses of the two different cell types. Significant changes from basal light output or reponses to the additions were assessed using Student's t test: n.s., not significant; ** P < 0.01; *** P < 0.001. In A, the calibration bar represents 200 s.
Figure 5
Figure 5. Differential glucose metabolism in neurons and glia
A and C, the dynamic response of [ATP]c in neurons and glia derived from the hypothalamus (A) or cerebellum (C) was monitored during the successive addition of 1 μg ml−1 oligomycin and 15 mm glucose, as described in Fig. 2.B and D show the average responses of the two different cell types. Significant changes of light output from basal values, and responses to the additions, were assessed by Student's t test: n.s., not significant; * P < 0.05; ** P < 0.01; *** P < 0.001. In A and C, calibration bars represent 200 s.
Figure 6
Figure 6. Lactate-induced changes in NAD(P)H fluorescence and [ATP]c
A and D, the response of NAD(P)H levels to addition of 5 mm lactate was monitored in hypothalamic (A) and cerebellar (D) neurons and glia, as described in Fig. 1.B and E, the response of [ATP]c in neurons and glia derived from the hypothalamus (B) or cerebellum (E) was monitored during successive addition of 5 mm lactate and 1 μg ml−1 oligomycin, as described in Fig. 2.C and F show the average responses of the different cell types. Significant changes from basal light output and responses to the additions were assessed by Student's t test: n.s., not significant; * P < 0.05; ** P < 0.01; *** P < 0.001. In A, B, D and E, calibration bars represent 200 s.
Figure 7
Figure 7. Removal of extracellular glucose hyperpolarises GR neurons despite high intracellular ATP levels
A, continuous whole-cell current-clamp recording from an arcuate GR neuron. In the presence of a high intracellular ATP concentration (3 mm), removal of extracellular glucose caused membrane hyperpolarisation and cessation of action potential firing with a concomitant reduction in input resistance. Application of tolbutamide (200 μM) reversed the effects of glucose removal. Washout of tolbutamide allowed the effects of glucose removal to re-emerge. B, left, electronic potentials elicited in response to current-pulse injection (lower panel) in the presence (Control) and absence of glucose. Right, the corresponding current-voltage relationships showed a reversal potential near −90 mV indicating activation of a K+ conductance.
Figure 8
Figure 8. MCT1 expression in cultures of hypothalamic neurons and glia
Immunocytochemistry (see Methods) was performed using a polyclonal anti-MCT1 primary antibody and imaged using confocal microscopy. Similar experiments using a polyclonal anti-MCT2 antibody revealed no strong staining (not shown).
Figure 9
Figure 9. Lactate inhibits KATP channel activity in GR neurons
Sample cell-attached recordings taken at different time points from a single experiment. Following cell-attached formation, with 3 mm glucose in the bathing medium, channel activity was minimal. Removal of extracellular glucose resulted in an increase in KATP channel activity (openings downward) within 5-10 min. Bath application of 5 mm lactate caused a marked reduction in the glucose-free induced KATP channel activity. c denotes the channel closed state and biphasic potentials denote action potential firing. NfPo values: 3 mm glucose, 0.01; glucose free, 0.17; 5 mm lactate, 0.05.
Figure 10
Figure 10. Proposed mechanisms of glucose sensing in GR hypothalamic neurons
Increases in extracellular glucose concentration lead to the closure of neuronal KATP channels by a direct, but as yet undefined, mechanism (1), which does not involve increases in intracellular ATP concentration. However, mitochondrial metabolism of glucose carbons increases ATP synthesis, as revealed by the addition of ouabain to inhibit ATP consumption (Fig. 4). Anaerobic metabolism of glucose by astrocytes (2) and transfer of lactate to neighbouring neurons, may, under some circumstances, lead to enhanced ATP synthesis in the latter and thus contribute to the closure of KATP channels. ox. phos., oxidative phosphorylation.

Comment in

References

    1. Ainscow EK, Rutter GA. Mitochondrial priming modifies Ca2+ oscillations and insulin secretion in pancreatic islets. Biochemical Journal. 2001;353:175–180. - PMC - PubMed
    1. Ainscow EK, Zhao C, Rutter GA. Acute overexpression of lactate dehydrogenase-A perturbs β-cell mitochondrial metabolism and insulin secretion. Diabetes. 2000;49:1149–1155. - PubMed
    1. Ämmälä C, Eliasson L, Bokvist K, Berggren PO, Honkanen RE, Sjoholm A, Rorsman P. Activation of protein kinases and inhibition of protein phosphatases play a central role in the regulation of exocytosis in mouse pancreatic β cells. Proceedings of the National Academy of Sciences of the USA. 1994;91:4343–4347. - PMC - PubMed
    1. Ashford ML, Boden PR, Treherne JM. Glucose-induced excitation of hypothalamic neurones is mediated by ATP-sensitive K+ channels. Pflügers Archiv. 1990;415:479–483. - PubMed
    1. Bergmeyer H-U. Lactate. In: Bergmeyer H-U, editor. Methods of Enzymatic Analysis. 2. New York, London: Weinheim-Verlag Chemie, Academic Press; 1965. pp. 278–282.

Publication types

MeSH terms

LinkOut - more resources