

Electrically evoked dendritic pH transients in rat cerebellar Purkinje cells
- PMID: 12381821
- PMCID: PMC2290602
- DOI: 10.1113/jphysiol.2002.027508
Electrically evoked dendritic pH transients in rat cerebellar Purkinje cells
Abstract
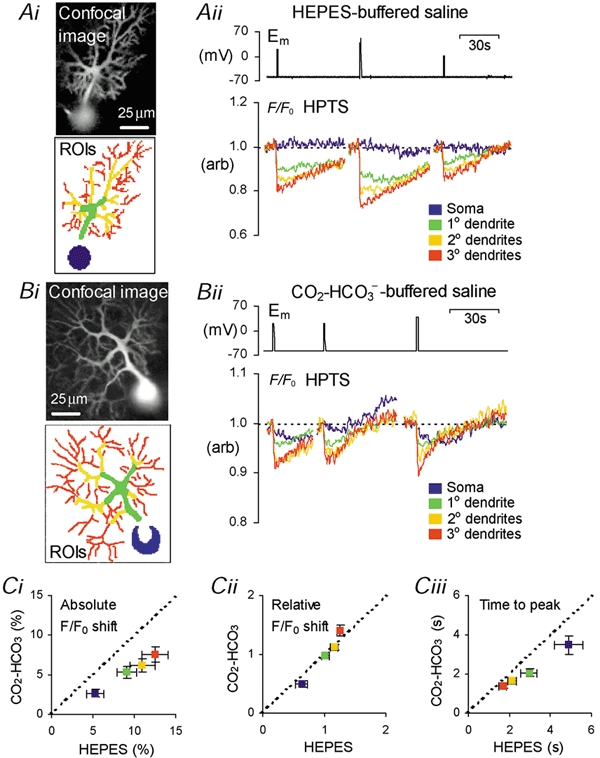
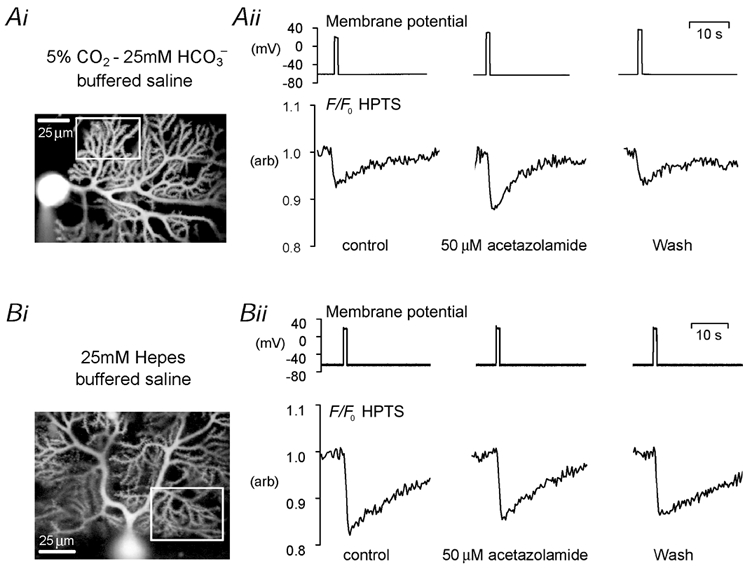
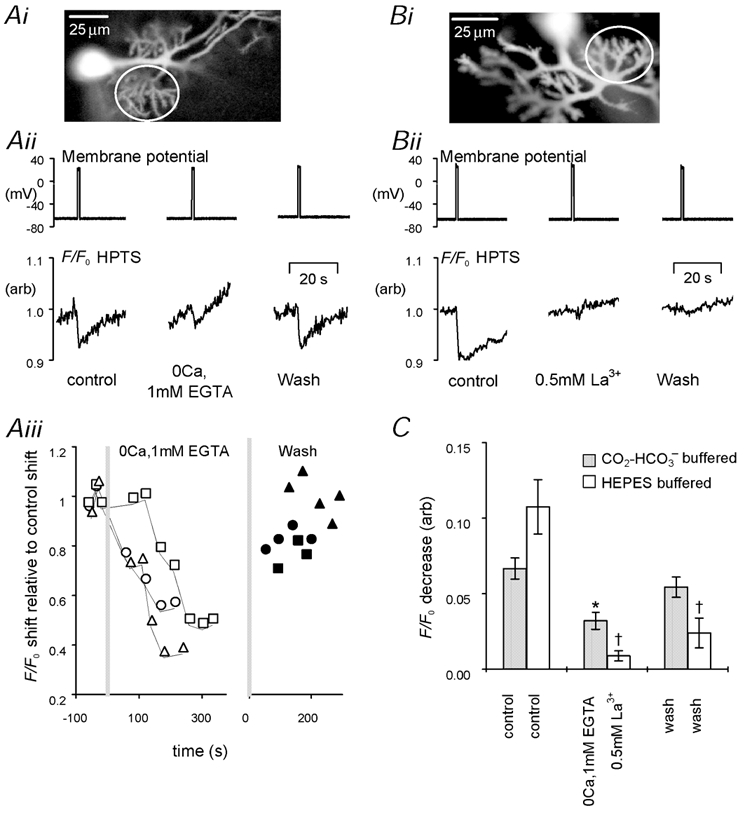
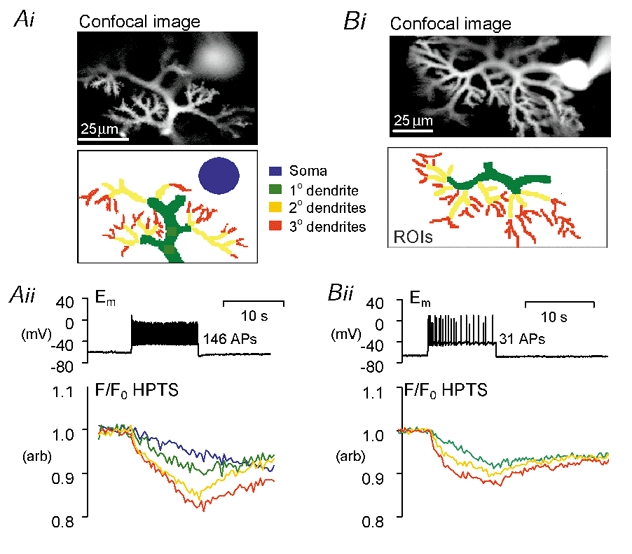
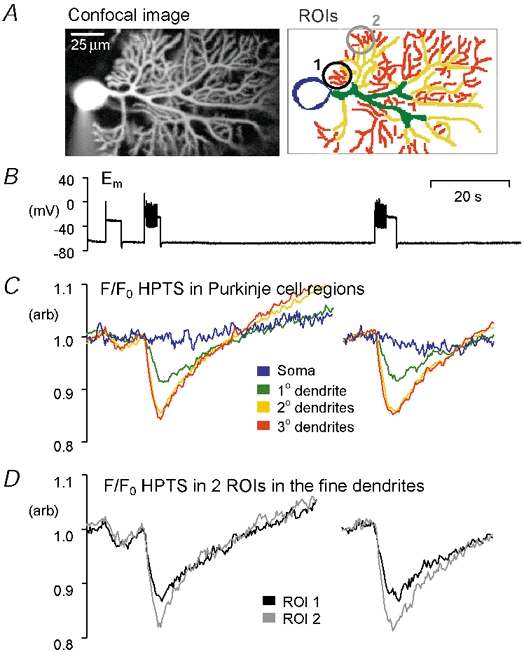
Our aim was to test the hypothesis that depolarization-induced intracellular pH (pH(i)) shifts in restricted regions (dendrites) of mammalian neurones might be larger and faster than those previously reported from the cell soma. We used confocal imaging of the pH-sensitive dye, HPTS, to measure pH changes in both the soma and dendrites of whole-cell patch-clamped rat cerebellar Purkinje cells. In the absence of added CO(2)-HCO(3)(-), depolarization to +20 mV for 1 s caused large (approximately 0.14 pH units) and fast dendritic acid shifts, whilst the somatic acidifications were significantly smaller (approximately 0.06 pH units) and slower. The pH(i) shifts were smaller in the presence of 5 % CO(2)-25 mM HCO(3)(-)-buffered saline (approximately 0.08 pH units in the dendrites and approximately 0.03 pH units in the soma), although a clear spatiotemporal heterogeneity remained. Acetazolamide (50 microM) doubled the size of the dendritic acid shifts in the presence of CO(2)-HCO(3)(-), indicating carbonic anhydrase activity. Removal of extracellular calcium or addition of the calcium channel blocker lanthanum (0.5 mM) inhibited the depolarization-evoked acid shifts. We investigated more physiological pH(i) changes by evoking modest bursts of action potentials (approximately 10 s duration) in CO(2)-HCO(3)(-)-buffered saline. Such neuronal firing induced an acidification of approximately 0.11 pH units in the fine dendritic regions, but only approximately 0.03 pH units in the soma. There was considerable variation in the size of the pH(i) shifts between cells, with dendritic acid shifts as large as 0.2-0.3 pH units following a 10 s burst of action potentials in some Purkinje cells. We postulate that these large dendritic pH(i) changes (pH microdomains) might act as important signals in synaptic function.
Figures
Similar articles
-
Depolarization-induced pH microdomains and their relationship to calcium transients in isolated snail neurones.J Physiol. 2002 Jan 15;538(Pt 2):371-82. doi: 10.1113/jphysiol.2001.013055. J Physiol. 2002. PMID: 11790806 Free PMC article.
-
Calcium transients in cerebellar Purkinje neurons evoked by intracellular stimulation.J Neurophysiol. 1992 Oct;68(4):1167-77. doi: 10.1152/jn.1992.68.4.1167. J Neurophysiol. 1992. PMID: 1432076
-
Spatial distribution of synaptically activated sodium concentration changes in cerebellar Purkinje neurons.J Neurophysiol. 1997 Jan;77(1):145-52. doi: 10.1152/jn.1997.77.1.145. J Neurophysiol. 1997. PMID: 9120555
-
Dendritic signal integration.Curr Opin Neurobiol. 1997 Jun;7(3):385-90. doi: 10.1016/s0959-4388(97)80067-0. Curr Opin Neurobiol. 1997. PMID: 9232799 Review.
-
Modulation of pH by neuronal activity.Trends Neurosci. 1992 Oct;15(10):396-402. doi: 10.1016/0166-2236(92)90191-a. Trends Neurosci. 1992. PMID: 1279865 Review.
Cited by
-
Somatic vs. dendritic responses to hypercapnia in chemosensitive locus coeruleus neurons from neonatal rats.Am J Physiol Cell Physiol. 2005 Nov;289(5):C1094-104. doi: 10.1152/ajpcell.00329.2004. Epub 2005 Jul 13. Am J Physiol Cell Physiol. 2005. PMID: 16014703 Free PMC article.
-
NO signalling decodes frequency of neuronal activity and generates synapse-specific plasticity in mouse cerebellum.J Physiol. 2005 Aug 1;566(Pt 3):849-63. doi: 10.1113/jphysiol.2005.088799. Epub 2005 May 26. J Physiol. 2005. PMID: 15919714 Free PMC article.
-
Sarcolemmal localisation of Na+/H+ exchange and Na+-HCO3- co-transport influences the spatial regulation of intracellular pH in rat ventricular myocytes.J Physiol. 2013 May 1;591(9):2287-306. doi: 10.1113/jphysiol.2012.249664. Epub 2013 Feb 18. J Physiol. 2013. PMID: 23420656 Free PMC article.
-
Lactate Attenuates Synaptic Transmission and Affects Brain Rhythms Featuring High Energy Expenditure.iScience. 2020 Jul 24;23(7):101316. doi: 10.1016/j.isci.2020.101316. Epub 2020 Jun 27. iScience. 2020. PMID: 32653807 Free PMC article.
-
The weak bases NH(3) and trimethylamine inhibit the medium and slow afterhyperpolarizations in rat CA1 pyramidal neurons.Pflugers Arch. 2005 Dec;451(3):418-27. doi: 10.1007/s00424-005-1483-6. Epub 2005 Jul 27. Pflugers Arch. 2005. PMID: 16047153
References
-
- Amos BJ, Pocock G, Richards CD. On the role of bicarbonate as a hydrogen ion buffer in rat CNS neurones. Experimental Physiology. 1996;81:623–632. - PubMed
-
- Ballanyi K, Kaila K. Activity-evoked changes in intracellular pH. In: Kaila K, Ransom BR, editors. pH and Brain Function. New York: Wiley-Liss; 1998. pp. 291–308. chap. 16.
-
- Boron WF, De Weer P. Active proton transport stimulation by CO2/HCO3−, blocked by cyanide. Nature. 1976;259:240–241. - PubMed
-
- Chesler M. The regulation and modulation of pH in the nervous system. Progress in Neurobiology. 1990;34:401–427. - PubMed
Publication types
MeSH terms
Substances
LinkOut - more resources
Full Text Sources