. 2002 Oct 15;544(2):501-9.
doi: 10.1113/jphysiol.2002.027862.

Individual mouse taste cells respond to multiple chemical stimuli

Affiliations

Individual mouse taste cells respond to multiple chemical stimuli

Alejandro Caicedo et al. J Physiol. .

Abstract

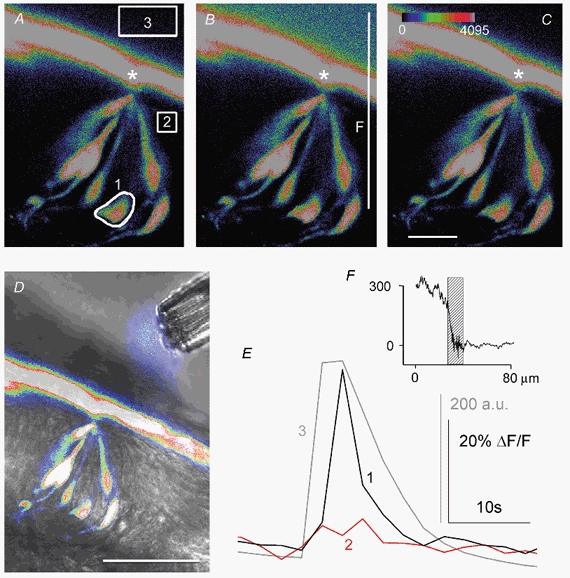
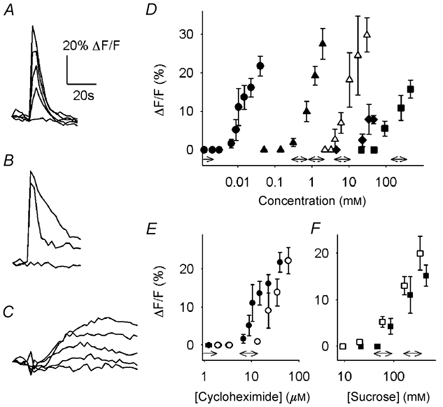
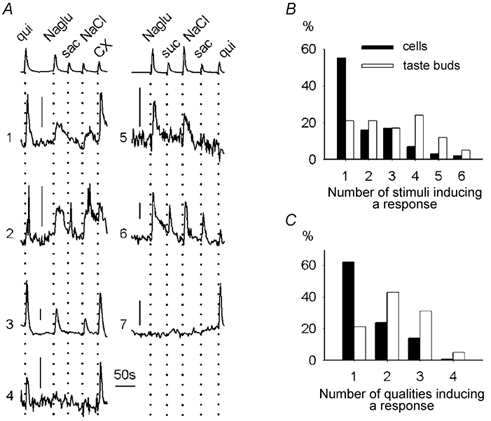
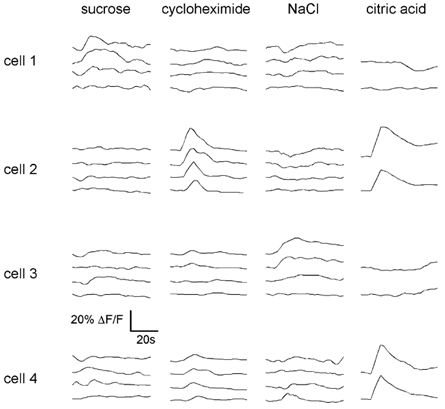
Sensory organs are specialized to detect and decode stimuli in terms of intensity and quality. In the gustatory system, the process of identifying and distinguishing taste qualities (e.g. bitter versus sweet) begins in taste buds. A central question in gustatory research is how information about taste quality is extracted by taste receptor cells. For instance, whether and how individual taste cells respond to multiple chemical stimuli is still a matter for debate. A recent study showed that taste cells expressing bitter-responsive taste receptors do not also express sweet-responsive taste receptors and vice versa. These results suggest that the gustatory system may use separate cellular pathways to process bitter and sweet signals independently. Results from electrophysiological studies, however, reveal that individual taste receptor cells respond to stimuli representing multiple taste qualities. Here we used non-invasive Ca(2+) imaging in slices of lingual tissue containing taste buds to address the issue of quality detection in murine taste receptor cells. We recorded calcium transients elicited by chemical stimuli representing different taste qualities (sweet, salty, sour and bitter). Many receptor cells (38 %) responded to multiple taste qualities, with some taste cells responding to both appetitive ("sweet") and aversive ("bitter") stimuli. Thus, there appears to be no strict and separate detection of taste qualities by distinct subpopulations of taste cells in peripheral gustatory sensory organs in mice.


Figures

Figure 1
Figure 1. Ca2+ response to local apical stimulation with the bitter compound quinine
A-C, three sequential confocal images of a lingual slice showing seven individual taste cells loaded with Calcium Green-1 dextran (CaGD) in a vallate taste bud. The regions selected for fluorescence measurements are outlined (1-3). Only one cell (1) responded to the stimulus, with maximum ΔF/F occurring in the image in B. Fluorescein (2 μM) was included in the quinine solution to monitor stimulus application and concentration near the taste pore (outline 3, A). Apical processes extend to and converge at the taste pore (*). Scale bar, 20 μm; colour palette shows the pixel intensity mapping (range: 0-4095, 12-bit data). D, superimposed fluorescence and transmitted light image of the multi-barrelled pipette during focal apical stimulation showing the onset of quinine stimulation (fluorescence at tip of pipette). Scale bar, 50 μm. E, quantitative fluorescence changes for the experiment shown in A-C. Focal application of quinine (3) elicited a rapid response in one taste cell (1). Traces 1-3 correspond to the regions outlined in A. a.u., arbitrary units of pixel intensity. F, the stimulus gradient between the bath solution and interstitial tissue adjacent to the taste bud shows that chemical stimuli do not penetrate into the lingual tissue. The fluorescence intensity of the fluorescein (in quinine solution) measured along the vertical line shown in B (F) was taken before (A) and at the peak (B) of the stimulus. The difference (B minus A) is shown in F. Hatched bar: layer of fluorescent CaGD adhering to the surface of the epithelium (grey layer in A-D).
Figure 2
Figure 2. Ca2+ responses elicited by compounds representing different taste qualities, measured in cell bodies of single taste cells
All responses were concentration dependent and had distinctive time courses. A-C, representative responses in three different taste cells evoked by cycloheximide (A), citric acid (B) and sucrose (C) at progressively higher stimulus concentrations. D, concentration-response relationships showing different potencies for cycloheximide (•), quinine (▴), citric acid (▵), saccharin (♦) and sucrose (▪). Responses are from at least five taste cells. Data shown are means ± s.e.m. The corresponding behavioural thresholds show the same sequence and approximate ranges (double-headed arrows above abscissa; data in D-F from Lush, 1984, 1989; Lush & Holland, 1988; Whitney et al. 1990; Whitney & Harder, 1994; Bachmanov et al. 2001). E and F, concentration-response relationships for cycloheximide (E) and sucrose (F) in DBA/2J (filled symbols) and C57BL/6B (open symbols) mice.
Figure 3
Figure 3. Chemical specificity of taste cells
A, sequential stimulation with five stimuli at concentrations ≥ 3 times threshold induced different responses in seven different taste cells in two taste buds. Top traces show the stimulus applications. Three cells responded to one taste quality (bitter: cells 4 and 7; salty: cell 5), two cells to two qualities (bitter and salty: cells 1 and 3), and two to three qualities (bitter, salty and sweet: cells 2 and 6). Scale bars, 10 % ΔF/F. B, percentage of cells and taste buds responding to one or more stimuli. For the taste bud analyses we grouped the responses of all responding cells in a taste bud. C, percentage of cells and taste buds responding to one or more taste qualities. Monosodium glutamate and NaCl were grouped in one class for this analysis. CX, cycloheximide; qui, quinine; suc, sucrose; sac, saccharin; Naglu, monosodium glutamate.
Figure 4
Figure 4. Chemical specificity of taste cells does not vary with stimulus concentration
Stimulation with four stimuli at progressively higher concentrations in four different taste cells. Cell 1 responded selectively to sucrose, cell 2 to cycloheximide and citric acid, cell 3 to NaCl and cell 4 to citric acid. These response patterns were stable across concentrations for all cells. Tested concentrations were: sucrose, 24, 288, 622, 900 mm; cycloheximide, 93, 267, 448, 490 μM; NaCl, 60, 70, 495, 975 mm; citric acid, 32 and 190 mm. Only two concentrations could be tested for citric acid.
Figure 5
Figure 5. Association between coincidences of chemospecificity in individual cells
A, contingency table of the responses of individual cells to seven different stimuli. Values represent the observed number of taste cells responding to the two chemical stimuli, indicated by the row and column headings. Numbers in parentheses are the expected number of cells if the responses were to occur independently (calculated as in Gilbertson et al. 2001). B, P values obtained from multiple pairwise comparisons of the data in A2 test). Note that the log of the P values is plotted. To indicate negative (i.e. coincidence was smaller than expected, see A) or positive (coincidence was greater than expected) associations, we arbitrarily assigned negative and positive signs to the log of the P value. The strongest associations were saccharin with sucrose, monosodium glutamate with NaCl, and sucrose with NaCl. These associations are also indicated in bold in A. Abbreviations as in Fig. 3. cit, citric acid.

References

    1. Adler E, Hoon MA, Mueller KL, Chandrashekar J, Ryba NJ, Zuker CS. A novel family of mammalian taste receptors. Cell. 2000;100:693–702. - PubMed
    1. Akabas MH, Dodd J, Al-Awqati Q. A bitter substance induces a rise in intracellular calcium in a subpopulation of rat taste cells. Science. 1988;242:1047–1050. - PubMed
    1. Bachmanov AA, Tordoff MG, Beauchamp GK. Sweetener preference of C57BL/6ByJ and 129P3/J mice. Chemical Senses. 2001;26:905–913. - PMC - PubMed
    1. Bernhardt SJ, Naim M, Zehavi U, Lindemann B. Changes in IP3 and cytosolic Ca2+ in response to sugars and non-sugar sweeteners in transduction of sweet taste in the rat. Journal of Physiology. 1996;490:325–336. - PMC - PubMed
    1. Caicedo A, Jafri MS, Roper SD. In situ Ca2+ imaging reveals neurotransmitter receptors for glutamate in taste receptor cells. Journal of Neuroscience. 2000;20:7978–7985. - PMC - PubMed

Publication types

LinkOut - more resources