

A modelling study of locomotion-induced hyperpolarization of voltage threshold in cat lumbar motoneurones
- PMID: 12381824
- PMCID: PMC2290604
- DOI: 10.1113/jphysiol.2002.026005
A modelling study of locomotion-induced hyperpolarization of voltage threshold in cat lumbar motoneurones
Abstract
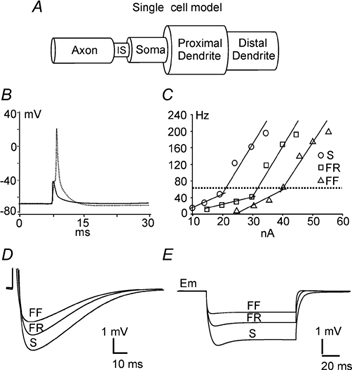
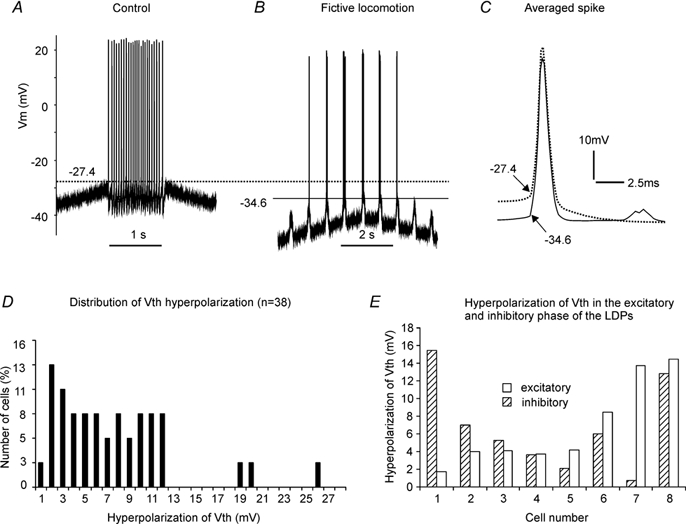
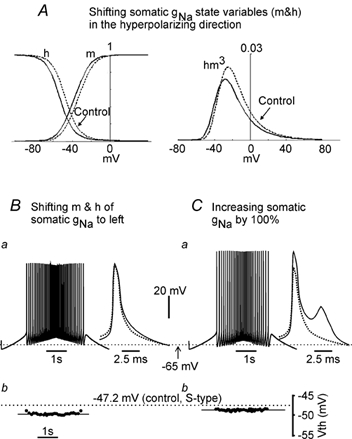
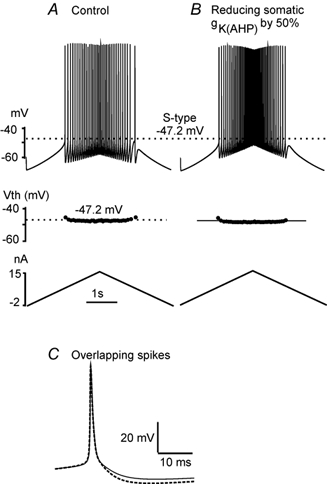
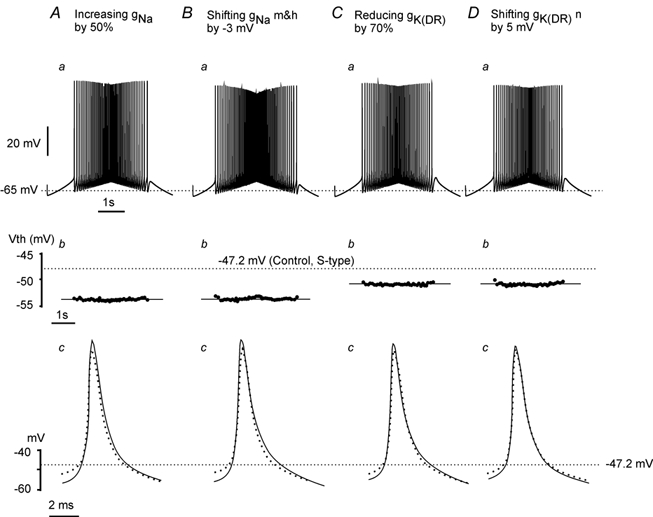
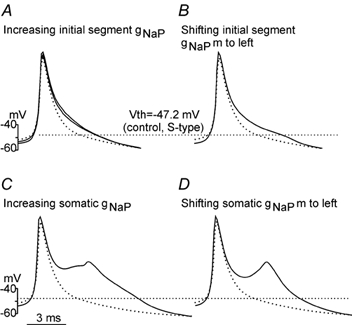
During fictive locomotion the excitability of adult cat lumbar motoneurones is increased by a reduction (a mean hyperpolarization of approximately 6.0 mV) of voltage threshold (Vth) for action potential (AP) initiation that is accompanied by only small changes in AP height and width. Further examination of the experimental data in the present study confirms that Vth lowering is present to a similar degree in both the hyperpolarized and depolarized portions of the locomotor step cycle. This indicates that Vth reduction is a modulation of motoneurone membrane currents throughout the locomotor state rather than being related to the phasic synaptic input within the locomotor cycle. Potential ionic mechanisms of this locomotor-state-dependent increase in excitability were examined using three five-compartment models of the motoneurone innervating slow, fast fatigue resistant and fast fatigable muscle fibres. Passive and active membrane conductances were set to produce input resistance, rheobase, afterhyperpolarization (AHP) and membrane time constant values similar to those measured in adult cat motoneurones in non-locomoting conditions. The parameters of 10 membrane conductances were then individually altered in an attempt to replicate the hyperpolarization of Vth that occurs in decerebrate cats during fictive locomotion. The goal was to find conductance changes that could produce a greater than 3 mV hyperpolarization of Vth with only small changes in AP height (< 3 mV) and width (< 1.2 ms). Vth reduction without large changes in AP shape could be produced either by increasing fast sodium current or by reducing delayed rectifier potassium current. The most effective Vth reductions were achieved by either increasing the conductance of fast sodium channels or by hyperpolarizing the voltage dependency of their activation. These changes were particularly effective when localized to the initial segment. Reducing the conductance of delayed rectifier channels or depolarizing their activation produced similar but smaller changes in Vth. Changes in current underlying the AHP, the persistent Na(+) current, three Ca(2+) currents, the "h" mixed cation current, the "A" potassium current and the leak current were either ineffective in reducing Vth or also produced gross changes in the AP. It is suggested that the increased excitability of motoneurones during locomotion could be readily accomplished by hyperpolarizing the voltage dependency of fast sodium channels in the axon hillock by a hitherto unknown neuromodulatory action.
Figures
Similar articles
-
State-dependent hyperpolarization of voltage threshold enhances motoneurone excitability during fictive locomotion in the cat.J Physiol. 2001 Apr 1;532(Pt 1):271-81. doi: 10.1111/j.1469-7793.2001.0271g.x. J Physiol. 2001. PMID: 11283241 Free PMC article.
-
The excitability of lumbar motoneurones in the neonatal rat is increased by a hyperpolarization of their voltage threshold for activation by descending serotonergic fibres.J Physiol. 2004 Jul 1;558(Pt 1):213-24. doi: 10.1113/jphysiol.2004.064717. Epub 2004 Apr 30. J Physiol. 2004. PMID: 15121804 Free PMC article.
-
Modulation of voltage-gated sodium channels hyperpolarizes the voltage threshold for activation in spinal motoneurones.Exp Brain Res. 2012 Mar;217(2):311-22. doi: 10.1007/s00221-011-2994-3. Epub 2012 Jan 5. Exp Brain Res. 2012. PMID: 22218500
-
Motoneuron output regulated by ionic channels: a modeling study of motoneuron frequency-current relationships during fictive locomotion.J Neurophysiol. 2018 Oct 1;120(4):1840-1858. doi: 10.1152/jn.00068.2018. Epub 2018 Jul 25. J Neurophysiol. 2018. PMID: 30044677
-
A modeling study of spinal motoneuron recruitment regulated by ionic channels during fictive locomotion.J Comput Neurosci. 2020 Nov;48(4):409-428. doi: 10.1007/s10827-020-00763-4. Epub 2020 Sep 8. J Comput Neurosci. 2020. PMID: 32895895
Cited by
-
Endurance-exercise training adaptations in spinal motoneurones: potential functional relevance to locomotor output and assessment in humans.Eur J Appl Physiol. 2022 Jun;122(6):1367-1381. doi: 10.1007/s00421-022-04918-2. Epub 2022 Feb 28. Eur J Appl Physiol. 2022. PMID: 35226169 Review.
-
Mechanisms underlying the early phase of spike frequency adaptation in mouse spinal motoneurones.J Physiol. 2005 Jul 15;566(Pt 2):519-32. doi: 10.1113/jphysiol.2005.086033. Epub 2005 May 5. J Physiol. 2005. PMID: 15878947 Free PMC article.
-
Reversal of the late phase of spike frequency adaptation in cat spinal motoneurons during fictive locomotion.J Neurophysiol. 2011 Mar;105(3):1045-50. doi: 10.1152/jn.00411.2010. Epub 2010 Dec 22. J Neurophysiol. 2011. PMID: 21177992 Free PMC article.
-
Dendritic distributions of L-type Ca2+ and SKL channels in spinal motoneurons: a simulation study.J Neurophysiol. 2020 Oct 1;124(4):1285-1307. doi: 10.1152/jn.00169.2020. Epub 2020 Sep 16. J Neurophysiol. 2020. PMID: 32937080 Free PMC article.
-
Modelling spinal circuitry involved in locomotor pattern generation: insights from deletions during fictive locomotion.J Physiol. 2006 Dec 1;577(Pt 2):617-39. doi: 10.1113/jphysiol.2006.118703. Epub 2006 Sep 28. J Physiol. 2006. PMID: 17008376 Free PMC article.
References
-
- Araki T, Terzuolo CA. Membrane currents in spinal motoneurones associated with the action potential and synaptic activity. Journal of Neurophysiology. 1962;25:772–789. - PubMed
-
- Astman N, Gutnick MJ, Fleidervish IA. Activation of protein kinase C increases neuronal excitability by regulating persistent Na+ current in mouse neocortical slices. Journal of Neurophysiology. 1998;80:1547–1551. - PubMed
Publication types
MeSH terms
Substances
LinkOut - more resources
Full Text Sources
Molecular Biology Databases
Miscellaneous