

Substance P-saporin lesion of neurons with NK1 receptors in one chemoreceptor site in rats decreases ventilation and chemosensitivity
- PMID: 12381830
- PMCID: PMC2290611
- DOI: 10.1113/jphysiol.2002.020032
Substance P-saporin lesion of neurons with NK1 receptors in one chemoreceptor site in rats decreases ventilation and chemosensitivity
Abstract
All medullary central chemoreceptor sites contain neurokinin-1 receptor immunoreactivity (NK1R-ir). We ask if NK1R-ir neurons and processes are involved in chemoreception. At one site, the retrotrapezoid nucleus/parapyramidal region (RTN/Ppy), we injected a substance P-saporin conjugate (SP-SAP; 0.1 pmol in 100 nl) to kill NK1R-ir neurons specifically, or SAP alone as a control. We made measurements for 15 days after the injections in two groups of rats. In group 1, with unilateral injections made in the awake state via a pre-implanted guide cannula, we compared responses within rats using initial baseline data. In group 2, with bilateral injections made under anaesthesia at surgery, we compared responses between SP-SAP- and SAP-treated rats. SP-SAP treatment reduced the volume of the RTN/Ppy region that contained NK1R-ir neuronal somata and processes by 44 % (group 1) and by 47 and 40 % on each side, respectively (group 2). Ventilation (.V(E)) and tidal volume (V(T)) were decreased during air breathing in sleep and wakefulness (group 2; P < 0.001; two-way ANOVA) and P(a,CO2) was increased (group 2; P < 0.05; Student's t test). When rats breathed an air mixture containing 7 % CO(2) during sleep and wakefulness, .V(E) and V(T) were lower (groups 1 and 2; P < 0.001; ANOVA) and the Delta.V(E) in air containing 7 % CO(2) compared to air was decreased by 28-30 % (group 1) and 17-22 % (group 2). SP-SAP-treated rats also slept less during air breathing. We conclude that neurons with NK1R-ir somata or processes in the RTN/Ppy region are either chemosensitive or they modulate chemosensitivity. They also provide a tonic drive to breathe and may affect arousal.
Figures


 comparing 7 % CO2 to air for unilateral (group 1) SP-SAP (top) and SAP control (bottom) during NREM sleep (○) and wakefulness (•). Data are means ±
  , VT and f. Air-breathing data are at the bottom of each panel; 7 % CO2 data at the top. Mean ±
  , VT and f. Air-breathing data are at the bottom of each panel; 7 % CO2 data at the top. Mean ±
 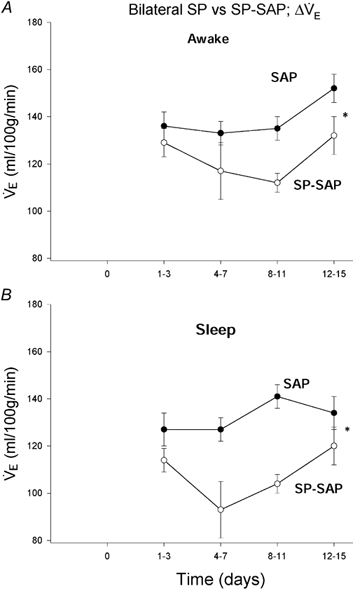 comparing 7 % CO2 to air for bilateral (group 2) SP-SAP (○) and SAP control (•) during wakefulness (top) and during NREM sleep (bottom). Data are means ±
 References
-
- Akilesh MR, Kamper M, Li A, Nattie EE. Effects of unilateral lesions of retrotrapezoid nucleus on breathing in awake rats. Journal of Applied Physiology. 1997;82:469–479. - PubMed
-
- Arvidsson U, Cullheim S, Ulfhake B, Luppi P, Kitahama K, Jouvet M, Hökfelt T. Quantitative and qualitative aspects on the distribution of 5-HT and its coexistence with substance P and TRH in cat ventral medullary neurons. Journal of Chemical Neuroanatomy. 1994;7:3–12. - PubMed
-
- Ballantyne D, Scheid P. Central chemosensitivity of respiration: a brief overview. Respiration Physiology. 2001;129:5–12. - PubMed
-
- Bennington JH, Kodali SK, Heller HC. Scoring transitions to REM sleep in rats based on the EEG phenomena of pre-REM sleep: an improved analysis of sleep structure. Sleep. 1994;17:28–35. - PubMed
-
- Berger AJ, Cooney KA. Ventilatory effects of kainic acid injection in the ventrolateral solitary nucleus. Journal of Applied Physiology. 1982;52:131–140. - PubMed
Publication types
MeSH terms
Substances
Grants and funding
LinkOut - more resources
Full Text Sources
Miscellaneous