. 2002 Nov;11(11):2606-21.
doi: 10.1110/ps.0215902.

MAMMOTH (matching molecular models obtained from theory): an automated method for model comparison

Affiliations

MAMMOTH (matching molecular models obtained from theory): an automated method for model comparison

Angel R Ortiz et al. Protein Sci. 2002 Nov.

Abstract

Advances in structural genomics and protein structure prediction require the design of automatic, fast, objective, and well benchmarked methods capable of comparing and assessing the similarity of low-resolution three-dimensional structures, via experimental or theoretical approaches. Here, a new method for sequence-independent structural alignment is presented that allows comparison of an experimental protein structure with an arbitrary low-resolution protein tertiary model. The heuristic algorithm is given and then used to show that it can describe random structural alignments of proteins with different folds with good accuracy by an extreme value distribution. From this observation, a structural similarity score between two proteins or two different conformations of the same protein is derived from the likelihood of obtaining a given structural alignment by chance. The performance of the derived score is then compared with well established, consensus manual-based scores and data sets. We found that the new approach correlates better than other tools with the gold standard provided by a human evaluator. Timings indicate that the algorithm is fast enough for routine use with large databases of protein models. Overall, our results indicate that the new program (MAMMOTH) will be a good tool for protein structure comparisons in structural genomics applications. MAMMOTH is available from our web site at http://physbio.mssm.edu/~ortizg/.


Figures
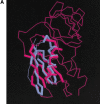
Fig. 1.
Fig. 1.
Examples of structural alignments obtained with MAMMOTH. (A) Alignment of 1pts_A with 1mup. The structural alignment score is 9.52; (B) Structural alignment of 1pgb with 5tss_A. The score in this case is 6.29.
Fig. 1.
Fig. 1.
Examples of structural alignments obtained with MAMMOTH. (A) Alignment of 1pts_A with 1mup. The structural alignment score is 9.52; (B) Structural alignment of 1pgb with 5tss_A. The score in this case is 6.29.
Fig. 2.
Fig. 2.
Running time as a function of problem size. In the x axis, the product of the length of the two sequences being compared is shown, whereas in the y axis, the structural alignment time in seconds is plotted.
Fig. 3.
Fig. 3.
Background distribution of random structural alignments. The percentage of structural similarity (PSI) after superimposing with MAMMOTH pairs of protein structures with different folds (see Materials and Methods and Table 1A in the appendix) is plotted as a function of the length of the shortest protein (Norm) being compared. All pairs of proteins in Table 1A are compared in the figure.
Fig. 4.
Fig. 4.
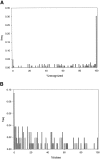
Extreme value distribution (EVD) fit at different length intervals (Norm). In bars is the frequency histogram of PSI values; in red, the EVD curve using parameters derived from the frequency histogram; in magenta is the curve obtained using EVD parameters derived from a fitting to Norm (see text for details). (A) Norm = 100; (B) Norm = 200.
Fig. 4.
Fig. 4.
Extreme value distribution (EVD) fit at different length intervals (Norm). In bars is the frequency histogram of PSI values; in red, the EVD curve using parameters derived from the frequency histogram; in magenta is the curve obtained using EVD parameters derived from a fitting to Norm (see text for details). (A) Norm = 100; (B) Norm = 200.
Fig. 5.
Fig. 5.
Length-dependent estimate of EVD parameters. Parameters fitted at each sequence interval are in turn modeled as a function of the length of the shortest protein in the comparison.
Fig. 6.
Fig. 6.
Coverage-error plot for MAMMOTH scores. See text for details.
Fig. 7.
Fig. 7.
Contour plot for family recognition. The percentage of family members recognized is plotted in the x axis; the y axis indicates the mean MAMMOTH score (−ln(P)) for that family. A density surface is contoured in the xy plane using 0.015 as contouring threshold. See text for additional details.
Fig. 8.
Fig. 8.
Cumulative frequency of family recognition at the detection threshold. (A) Percentage of members recognized per family. (B) Percentage of false positives.
Fig. 9.
Fig. 9.
Model quality using MAMMOTH scores. Each point is the mean P-value within each fold family as a function of the query protein length. Lines are a bilinear fitting using a cutoff at 200 residues (x < 200 and x > 200). Points correspond to individual families, and are colored as a function of PSI: red (0 < PSI ≤ 25), green (25 < PSI ≤ 50), cyan (50 < PSI ≤ 75), blue (75 < PSI ≤ 100).
Fig. 10.
Fig. 10.
Correlation between manual evaluation and automated scoring. Mean score by group given by Murzin against mean score produced by MAMMOTH. Each point is an average over all models submitted by each different group participating in CASP3.
Fig. 11.
Fig. 11.
Models submitted to CASP3 in the quality framework described in Figure 9 ▶. Each point is a model represented by the target length and the P-value obtained in the MAMMOTH superposition.
Fig. 12.
Fig. 12.
Cluster analysis of the different evaluation methods. See text for details.
Fig. 13.
Fig. 13.
Some typical “mistakes” in evaluation produced by other methods. The experimental structure is shown as a cartoon model. The matched portion of the theoretical model is shown in magenta, while the unmatched region is shown in gray. (A) t0071_g5; (B) t0083_g190.
Fig. 13.
Fig. 13.
Some typical “mistakes” in evaluation produced by other methods. The experimental structure is shown as a cartoon model. The matched portion of the theoretical model is shown in magenta, while the unmatched region is shown in gray. (A) t0071_g5; (B) t0083_g190.

Similar articles

Cited by

References

    1. Abagyan, R. and Batalov, S. 1997. Do aligned sequences share the same fold? J. Mol. Biol. 273 355–368. - PubMed
    1. Adams, P.D. and Grosse-Kunstleve, R.W. 2000. Recent developments in software for the automation of crystallographic macromolecular structure determination. Curr. Opin. Struct. Biol. 10 564–568. - PubMed
    1. Al-Hashimi, H.M. and Patel, D.J. 2002. Residual dipolar couplings: Synergy between NMR and structural genomics. J. Biomol. NMR 22 1–8. - PubMed
    1. Baker, D. and Sali, A. 2001. Protein structure prediction and structural genomics. Science 294 93–96. - PubMed
    1. Bonneau, B., Strauss, C., Rohl, C., Chivian, D., Bradley, P., Malmstrom, L., Robertson, T., Baker, D. 2002. De novo prediction of three-dimensional structures for major protein families. J. Mol. Biol. 322 65. - PubMed

Publication types