Comparative Study
. 2002 Oct 15;30(20):4556-66.
doi: 10.1093/nar/gkf568.

Analyses of single-copy Arabidopsis T-DNA-transformed lines show that the presence of vector backbone sequences, short inverted repeats and DNA methylation is not sufficient or necessary for the induction of transgene silencing

Affiliations
Comparative Study

Analyses of single-copy Arabidopsis T-DNA-transformed lines show that the presence of vector backbone sequences, short inverted repeats and DNA methylation is not sufficient or necessary for the induction of transgene silencing

Trine J Meza et al. Nucleic Acids Res. .

Abstract

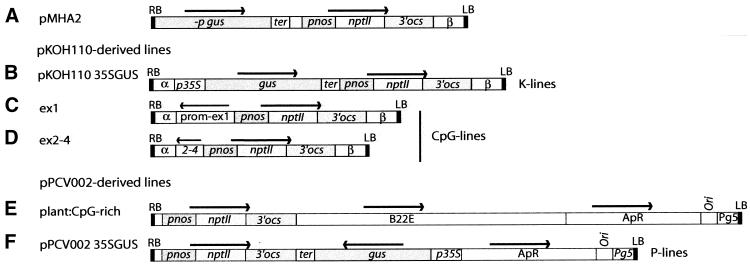
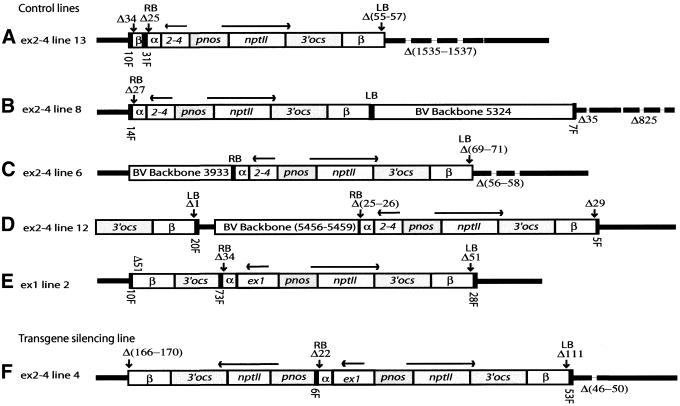
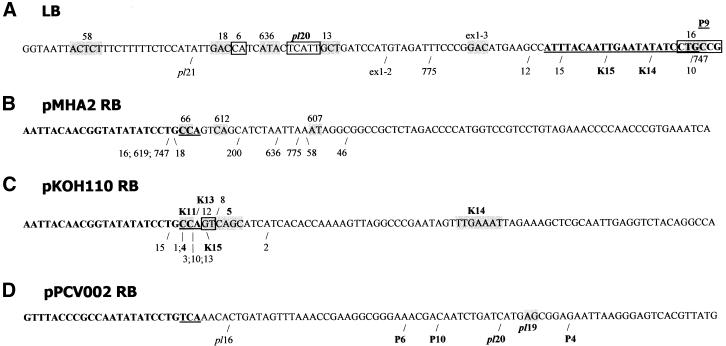
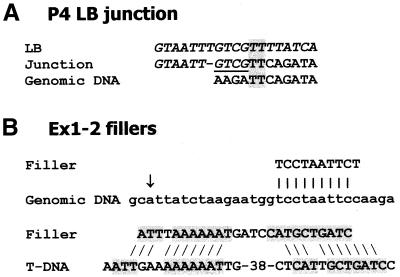
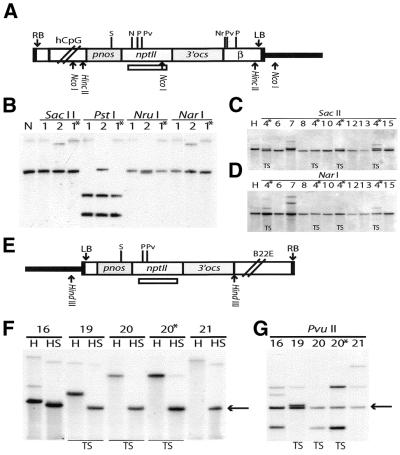
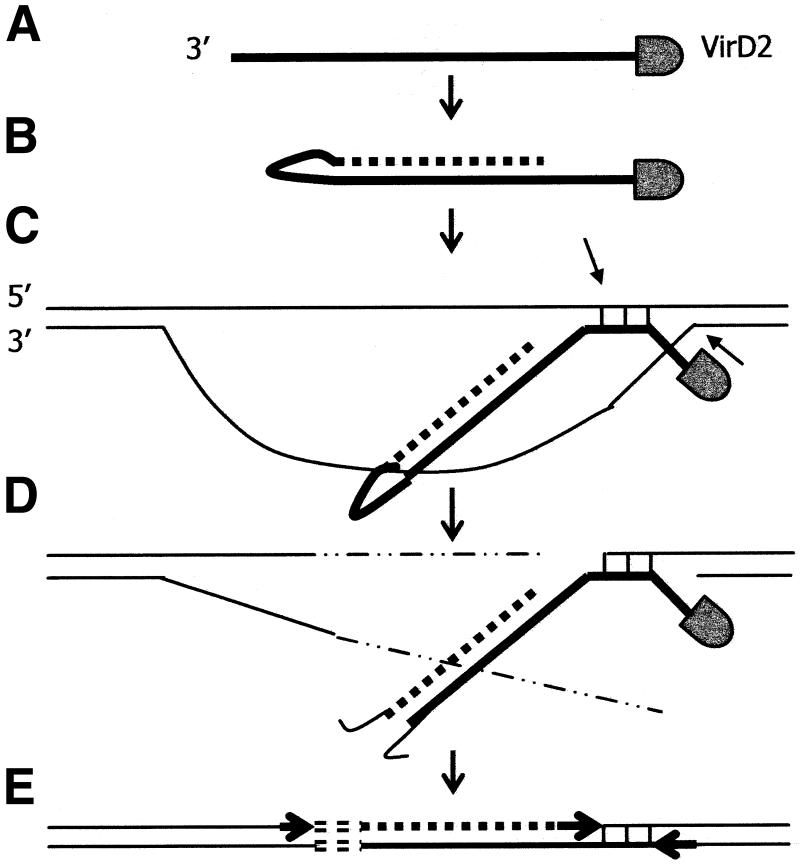
In genetically transformed plants, transgene silencing has been correlated with multiple and complex insertions of foreign DNA, e.g. T-DNA and vector backbone sequences. Occasionally, single-copy transgenes also suffer transgene silencing. We have compared integration patterns and T-DNA/plant DNA junctions in a collection of 37 single-copy T-DNA-transformed Arabidopsis lines, of which 13 displayed silencing. Vector sequences were found integrated in five lines, but only one of these displayed silencing. Truncated T-DNA copies, positioned in inverse orientation to an intact T-DNA copy, were discovered in three lines. The whole nptII gene with pnos promoter was present in the truncated copy of one such line in which heavy silencing has been observed. In the two other lines no silencing has been observed over five generations. Thus, vector sequences and short additional T-DNA sequences are not sufficient or necessary to induce transgene silencing. DNA methylation of selected restriction endonuclease sites could not be correlated with silencing. Our collection of T-DNA/plant DNA junctions has also been used to evaluate current models of T-DNA integration. Data for some of our lines are compatible with T-DNA integration in double-strand breaks, while for others initial invasion of plant DNA by the left or by the right T-DNA end seem important.


Figures

Figure 1
Figure 1
Vector constructs used in this study. (A) pMHA2; (B) pKOH110 35SGUS; (C) ex1; (D) ex2–4; (E) plant:CpG-rich; (F) pPCV002 35SGUS. RB, right border; LB, left border; gus, β-glucuronidase gene (udiA); –p gus, promoterless gus gene; prom–ex1 and 2–4, parts of the human CpG island comprising the promoter and exon 1, and exons 2–4 of the human MECL-1 gene, respectively; B22E, barley metallothionein-like gene; nptII, neomycin phosphotransferase gene; ApR, ampicillin resistance gene; pnos, nos promoter; 3ocs, ocs terminator; p35S, 35S promoter; ter, polyadenylation signal; α, β and Pg5 are natural T-DNA sequences. Horizontal arrows indicate direction of transcription.
Figure 2
Figure 2
T-DNA structure and target deletions in selected lines. T-DNAs are shown with intact LB and RB indicated by solid black boxes. Heavy black lines represent flanking genomic DNA, while broken lines represent target deletions. Δ denotes the number of base pairs deleted in targets and T-DNA border sequences. Numbers of base pairs in BVB sequences (open bars) and in filler sequences (F, solid black bars) are given. (A) ex2–4 line 13. Note the truncated inverted T-DNA copy covering 198 bp of the T-DNA β sequence, adjacent to the RB of the intact copy. (B) ex2–4 line 8. Note the 5324 bp BVB sequences continuing directly from the LB. (C) ex2–4 line 6. Note that 3948 bp of BVB sequence has been integrated upstream of the intact right border. (D) ex2–4 line 12. Note the truncated T-DNA copy of at least 1788 bp in direct orientation relative to the intact T-DNA and the 5456–5459 bp (of total 7209) BVB sequence, which has micro-homology at both ends. (E) ex1 line 2. Note the truncated copy of T-DNA (543 bp) comprising the 3ocs and β region in inverted orientation to the complete T-DNA copy. Only 1 bp has been deleted at the integration site. (F) ex2–4 line 4. Note the truncated T-DNA copy (2927 bp) comprising the whole nptII gene including the pnos promoter in inverted orientation to the complete T-DNA copy.
Figure 3
Figure 3
Right and left border deletions. The left end of all six constructs (A) and the right ends of the vectors pMHA2 (B), pKOH110 (C) and pPCV002 (D) are shown with the border repeats in bold. The nucleotides of the repeats present in the single-stranded T-DNA after VirD2 nicking at the preferred sites are underlined. The right or left end points of the T-DNAs in the different lines are indicated by /. In lines where there is micro-homology between T-DNA and genomic DNA at the target site the homologous nucleotides are boxed. Lines displaying nptII silencing are in bold. (A) All vectors have the same left end. 16, 18, 58, 636, 747 and 775 are pMHA2 lines; 6, 10, 12, 13, 15 are ex2–4 lines; pl20 and pl21 are plant:CpG-rich lines. The ex2–4 line 4 and line P4 have left end deletions of 111 and 178 bp, respectively, and could therefore not be included in the figure. (B) pMHA2 derived lines. (C) pKOH110-derived lines. 1, 2 and 3 are ex1 lines; 4, 5, 8, 10, 13, 15 are ex2–4 lines. (D) pPCV002-derived lines. pl16, pl19 and pl20 are plant:CpG-rich lines.
Figure 4
Figure 4
Examples of junctions and fillers. (A) LB junction of line P4. The T-DNA sequences are given in italic. The putative filler, which alternatively may be regarded as derived from the T-DNA, is underlined. Micro- homologies are boxed. (B) Fillers of ex1 line 2, in one case showing high similarity to genomic DNA close to the T-DNA insertion point (arrow) and in the other case patch-wise high similarity to T-DNA sequences.
Figure 5
Figure 5
Methylation analysis of sites in the pnosnptII region in CpG and Pl:CpG lines. DNA from transgenic plants generated with the constructs ex1 and ex2–4 (A) and plant:CpG-rich (E) was digested with a methylation- sensitive enzyme in combination with a delimiting methylation-insensitive enzyme. Digested DNA was subjected to Southern hybridisation with a nptII coding region probe [indicated in (A) and (E)]. (A) The nptII region common for both constructs is depicted (refer to Fig. 1). Sites for non-methylation-sensitive limiting enzymes, NcoI for ex1 and HincII for ex2–4, are shown. (B) Methylation analysis of ex1 lines 1 and 2 after digestion with NcoI (N) or this enzyme in combination with SacII/SstII, PstI, NarI or NruI. The latter sites are methylated when the hybridising fragment has the same size as the delimiting fragment (N). The presence of this fragment and in addition smaller fragments indicate partial methylation. (C) Methylation analysis of ex2–4 lines using the delimiting enzyme HincII (H) alone or in combination with SacII. A slightly shorter hybridising band is generated when the SacII site is unmethylated. (D) Methylation analysis of ex2–4 lines using the delimiting enzyme HincII (H) alone or in combination with NarI. Note that the hybridising fragment is identical in size to the delimiting fragment for all lines. (E and F) Methylation analysis in plant:CpG-rich lines with HindIII (H) as the delimiting enzyme. The SacII (S) site was unmethylated in all lines as indicated by a hybridising fragment of 1660 bp depicted by an arrow. (G) Methylation analysis in the PvuII site in plant:CpG-rich lines using HindIII as the delimiting enzyme. Note the partial methylation in all lines as indicated by fragments that are larger than the fragment of the delimiting enzyme, marked by an arrow. Thick lines, plant DNA; N, NarI; Nr, NruI; P, PstI; Pv, PvuII; S, SacII/SstII. Asterisks, siblings of same line; TS, transgene silencing lines.
Figure 6
Figure 6
T-DNA integration model based on micro-homologies between T-DNA and genomic DNA near the T-DNA RB (see also text). (A) Single-stranded T-DNA enters the nucleus covered with VirE2 protein (not shown) and with VirD2 attached to the 5′ end. (B) The 3′ end loops back and anneals to itself, thus providing a 3′-OH end to prime synthesis of a complementary T-DNA strand (broken line), thereby removing VirE2 (not shown). (C) T-DNA, still single stranded near the 5′ end, invades genomic DNA and finds a short stretch of micro-homology (vertical lines). Nicks will occur in the genomic DNA as indicated by the arrows. (D) The 3′ end loop in double-stranded T-DNA is degraded resulting in a left end deletion. Genomic DNA is degraded (thin broken lines), resulting in a target deletion. (E) VirD2 and the 5′ end of T-DNA upstream of the micro-homology is removed. Single-stranded gaps are repaired (arrows) and the DSB between the T-DNA left end and the genomic DNA is repaired, thereby generating filler DNA (short open bars).

Similar articles

Cited by

References

    1. Gheysen G., Angenon,G. and Van Montagu,M. (1998) Agrobacterium-mediated plant transformation: a scientifically intriguing story with significant applications. In Lindsey,K. (ed.), Transgenic Plant Research. Harwood Academic Publishers, Amsterdam, The Netherlands, pp. 1–33.
    1. Zupan J., Muth,T.R., Draper,O. and Zambryski,P. (2000) The transfer of DNA from Agrobacterium tumefaciens into plants: a feast of fundamental insights. Plant J., 23, 11–28. - PubMed
    1. Joos H., Timmermann,B., Van Montagu,M. and Schell,J. (1983) Genetic analysis of transfer and stabilization of Agrobacterium DNA in plant cells. EMBO J., 2, 2151–2160. - PMC - PubMed
    1. Jen G. and Chilton,M.-D. (1986) The right border region of pTiT37 T-DNA is intrinsically more active than the left border region in promoting T-DNA transformation. Proc. Natl Acad. Sci. USA, 83, 3895–3899. - PMC - PubMed
    1. Caplan A., Van Montagu,M. and Schell,J. (1985) Genetic analysis of integation mediated by single T-DNA borders. J. Bacteriol., 161, 655–664. - PMC - PubMed

Publication types