

GeneCensus: genome comparisons in terms of metabolic pathway activity and protein family sharing
- PMID: 12384605
- PMCID: PMC137121
- DOI: 10.1093/nar/gkf555
GeneCensus: genome comparisons in terms of metabolic pathway activity and protein family sharing
Abstract
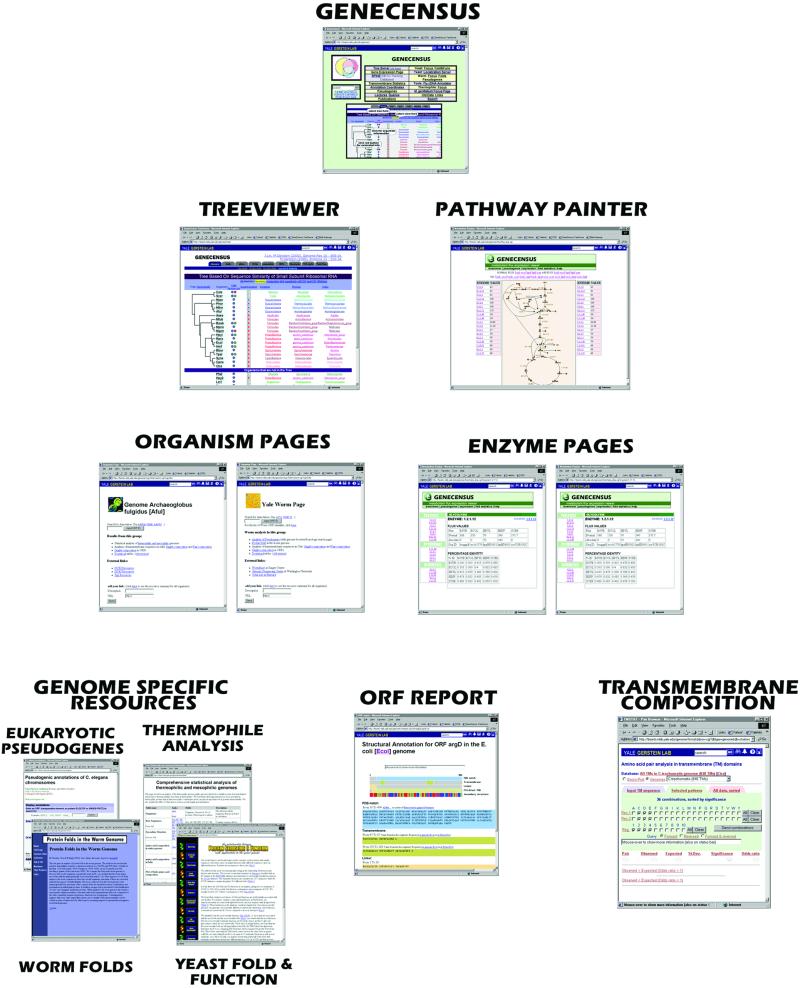
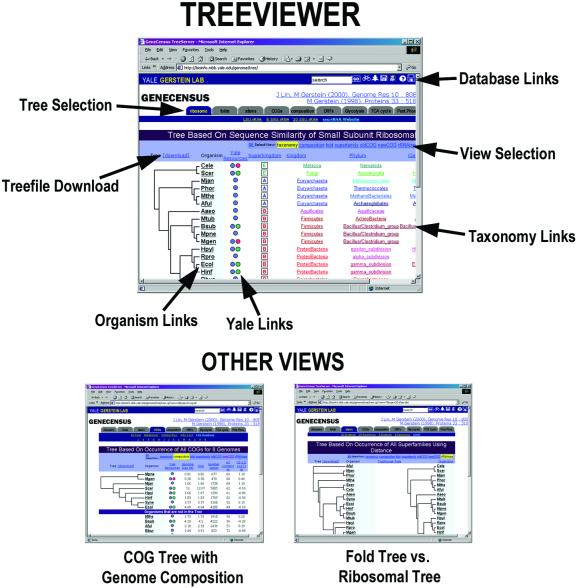
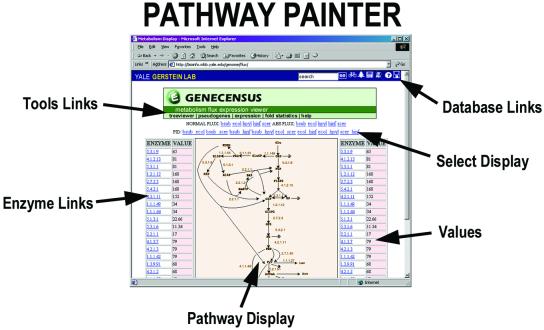
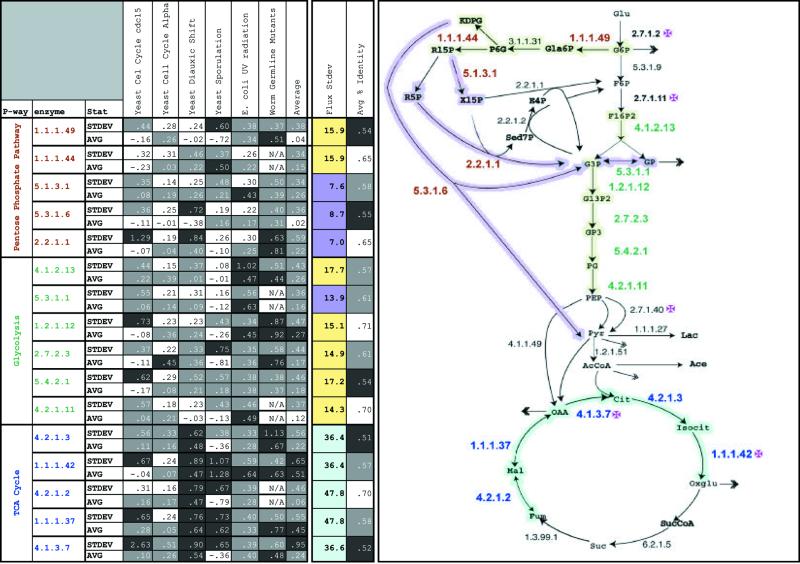
We present a prototype of a new database tool, GeneCensus, which focuses on comparing genomes globally, in terms of the collective properties of many genes, rather than in terms of the attributes of a single gene (e.g. sequence similarity for a particular ortholog). The comparisons are presented in a visual fashion over the web at GeneCensus.org. The system concentrates on two types of comparisons: (i) trees based on the sharing of generalized protein families between genomes, and (ii) whole pathway analysis in terms of activity levels. For the trees, we have developed a module (TreeViewer) that clusters genomes in terms of the folds, superfamilies or orthologs--all can be considered as generalized 'families' or 'protein parts'--they share, and compares the resulting trees side-by-side with those built from sequence similarity of individual genes (e.g. a traditional tree built on ribosomal similarity). We also include comparisons to trees built on whole-genome dinucleotide or codon composition. For pathway comparisons, we have implemented a module (PathwayPainter) that graphically depicts, in selected metabolic pathways, the fluxes or expression levels of the associated enzymes (i.e. generalized 'activities'). One can, consequently, compare organisms (and organism states) in terms of representations of these systemic quantities. Develop ment of this module involved compiling, calculating and standardizing flux and expression information from many different sources. We illustrate pathway analysis for enzymes involved in central metabolism. We are able to show that, to some degree, flux and expression fluctuations have characteristic values in different sections of the central metabolism and that control points in this system (e.g. hexokinase, pyruvate kinase, phosphofructokinase, isocitrate dehydrogenase and citric synthase) tend to be especially variable in flux and expression. Both the TreeViewer and PathwayPainter modules connect to other information sources related to individual-gene or organism properties (e.g. a single-gene structural annotation viewer).
Figures
Similar articles
-
PartsList: a web-based system for dynamically ranking protein folds based on disparate attributes, including whole-genome expression and interaction information.Nucleic Acids Res. 2001 Apr 15;29(8):1750-64. doi: 10.1093/nar/29.8.1750. Nucleic Acids Res. 2001. PMID: 11292848 Free PMC article.
-
Analysis of mRNA expression and protein abundance data: an approach for the comparison of the enrichment of features in the cellular population of proteins and transcripts.Bioinformatics. 2002 Apr;18(4):585-96. doi: 10.1093/bioinformatics/18.4.585. Bioinformatics. 2002. PMID: 12016056
-
Assessing annotation transfer for genomics: quantifying the relations between protein sequence, structure and function through traditional and probabilistic scores.J Mol Biol. 2000 Mar 17;297(1):233-49. doi: 10.1006/jmbi.2000.3550. J Mol Biol. 2000. PMID: 10704319
-
Global perspectives on proteins: comparing genomes in terms of folds, pathways and beyond.Pharmacogenomics J. 2001;1(2):115-25. doi: 10.1038/sj.tpj.6500021. Pharmacogenomics J. 2001. PMID: 11911438 Review.
-
Microbial genome analysis: the COG approach.Brief Bioinform. 2019 Jul 19;20(4):1063-1070. doi: 10.1093/bib/bbx117. Brief Bioinform. 2019. PMID: 28968633 Free PMC article. Review.
Cited by
-
Comparative Protein Structure Modeling Using MODELLER.Curr Protoc Bioinformatics. 2016 Jun 20;54:5.6.1-5.6.37. doi: 10.1002/cpbi.3. Curr Protoc Bioinformatics. 2016. PMID: 27322406 Free PMC article.
-
Comparative protein structure modeling using Modeller.Curr Protoc Bioinformatics. 2006 Oct;Chapter 5:Unit-5.6. doi: 10.1002/0471250953.bi0506s15. Curr Protoc Bioinformatics. 2006. PMID: 18428767 Free PMC article.
-
Current awareness on comparative and functional genomics.Comp Funct Genomics. 2003;4(2):277-84. doi: 10.1002/cfg.227. Comp Funct Genomics. 2003. PMID: 18629117 Free PMC article. No abstract available.
-
PDBe: Protein Data Bank in Europe.Nucleic Acids Res. 2010 Jan;38(Database issue):D308-17. doi: 10.1093/nar/gkp916. Epub 2009 Oct 25. Nucleic Acids Res. 2010. PMID: 19858099 Free PMC article.
-
GenDiS: Genomic Distribution of protein structural domain Superfamilies.Nucleic Acids Res. 2005 Jan 1;33(Database issue):D252-5. doi: 10.1093/nar/gki087. Nucleic Acids Res. 2005. PMID: 15608190 Free PMC article.
References
-
- Frishman D., Albermann,K., Hani,J., Heumann,K., Metanomski,A., Zollner,A. and Mewes,H.W. (2001) Functional and structural genomics using PEDANT. Bioinformatics, 17, 44–57. - PubMed
Publication types
MeSH terms
Substances
Grants and funding
LinkOut - more resources
Full Text Sources
Other Literature Sources
