

doi: 10.1126/science.1074887.
Shadows cast by retinal blood vessels mapped in primary visual cortex
Affiliations
- PMID: 12386328
- PMCID: PMC3155987
- DOI: 10.1126/science.1074887
Item in Clipboard
Shadows cast by retinal blood vessels mapped in primary visual cortex
Science.
.
Abstract
The mammalian eye is a remarkable optical device, but its design is not perfect. The blood vessels that supply the inner retina are located in front of the photoreceptor layer, blocking access to light. Their shadows create a pattern of blindness in the field of vision that corresponds precisely to the location of the largest vessels in the eye. We show here that in squirrel monkeys, focal deprivation by blood vessels leads to rewiring of the eye's geniculocortical projections, imprinting an image of the retinal vascular tree onto the primary visual cortex. This process illustrates vividly that local imbalances in neuronal activity can influence column formation during normal development.
Figures
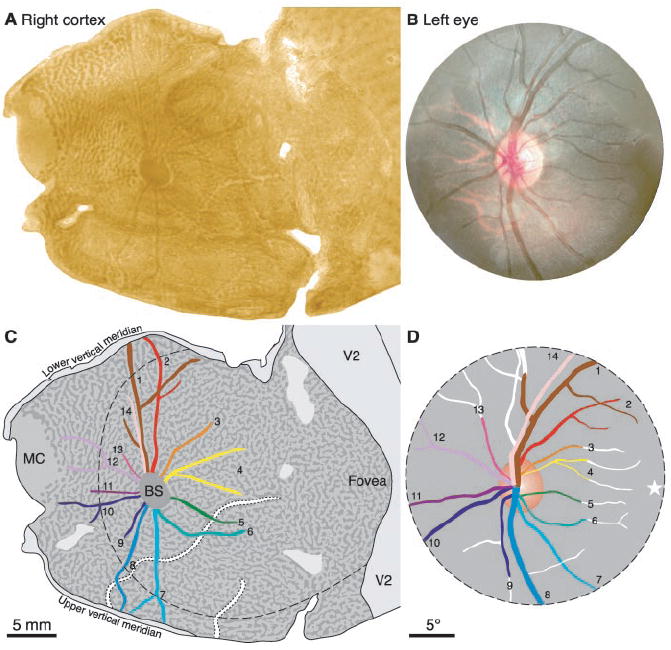
Representation of angioscotomas in striate cortex. (A) Flatmount montage stained for CO after removal of the left eye to reveal the ocular dominance columns. The dark lines emerging from the central dark oval correspond to the blood vessels of the left eye. (B) Fundus photograph showing optic disc and retinal blood vessels. (C) Drawing of vessel representations, color-coded to match the retinal drawing. Dashed line denotes circumference of retinal photograph in (B), projected onto the cortex. MC, monocular crescent; BS, blind spot. (D) Drawing of retina, with represented portions of vessels coded by color. Star denotes the fovea.
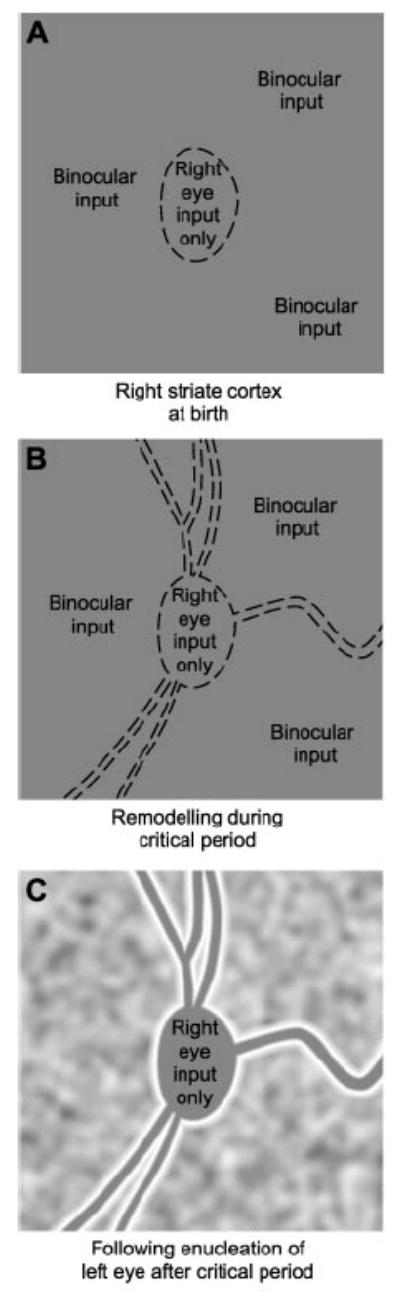
CO staining of angioscotoma representations. (A) At birth, CO staining is uniform. Angioscotomas are absent, but the right eye already monopolizes the left eye’s blind spot representation. (B) After light exposure, vessels begin to cast shadows, generating angioscotoma representations. Their pattern becomes immutable at the end of the critical period. (C) Removal of one eye induces an undulating pattern of CO activity, corresponding to the ocular dominance columns. The angioscotomas appear silhouetted against this textured background, because they stain solidly. Note the tendency for the other eye to “frost” the vessel and blind spot representations.
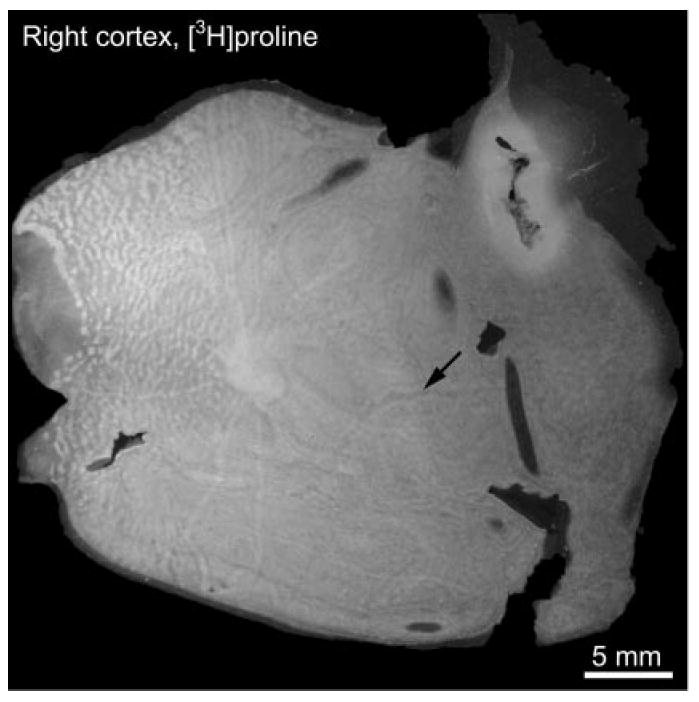
Autoradiograph prepared after tracer injection into the remaining right eye, showing label (bright regions) distributed in a pattern identical to that in Fig. 1A. The congruence of the patterns confirms that CO staining after monocular enucleation precisely reflects the distribution of geniculocortical inputs. The angioscotomas and the blind spot are solidly labeled, as predicted in Fig. 2C. Arrow denotes an unlabeled angioscotoma, arising from a temporal vessel in the right eye.

Vessels in nasal, compared with temporal, retina are represented more extensively. (A) Retinal photomontage. (B) CO staining after enucleation of the right eye. Most angioscotomas are dark, because they represent vessels of the right eye’s nasal retina, but a few are pale, representing the left eye’s temporal retina. (C) Drawing of the right fundus. The dotted lines outline the left eye’s blind spot and major inferior fundus vessels (see retinal montage, inset). Their temporal segments account for the two pale angioscotoma representations visible in the lower left cortex. (D) Drawing of CO pattern. Abbreviations as in Fig. 1.
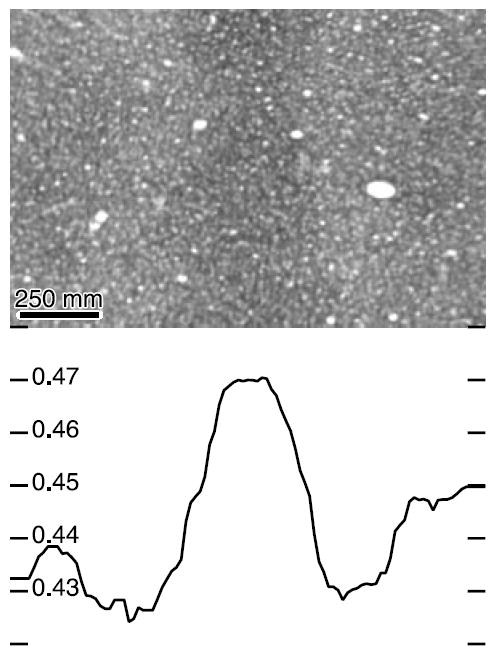
Vessel representations are flanked by CO activity of opposite contrast. A vertically oriented dark angioscotoma representation (Fig. 4D) is surrounded by pale staining. Mean optical density of each column of pixels is plotted below.
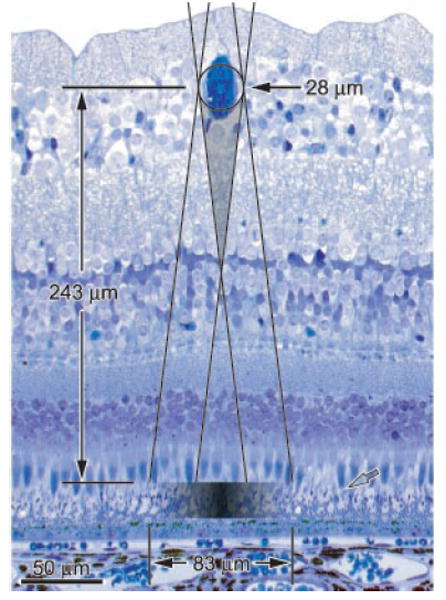
Optics of shadow formation. Toluidine blue–stained retinal cross section (Fig. 4C), showing the shadow cast by a blood vessel in the ganglion cell layer with a 28-μm lumen diameter, when fully inflated. Pairs of lines, projected from opposite margins of a 1.9-mm pupil located 8.4 mm in front of the retina, show the boundaries of the shadow obscuring photoreceptors. The umbra (gray triangle) does not reach the photoreceptor layer in this example, because the vessel is too small. Gradient indicates penumbra, which reached a maximum optical density of 0.45. Open arrow shows the light-recipient boundary between cone inner and outer segments.
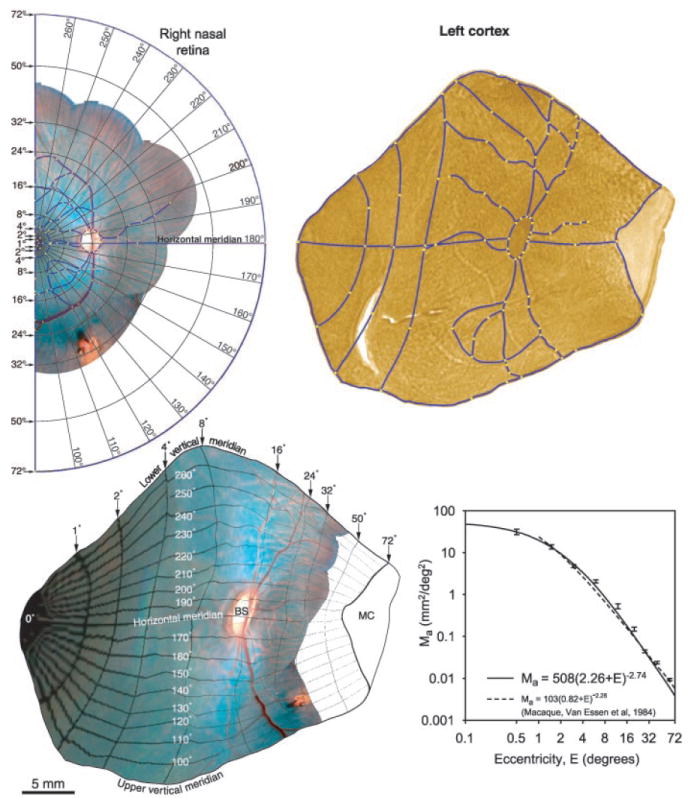
Generation of a retinotopic map. Ring and ray pattern is superimposed on the right retina, using landmarks plotted in vivo. Correspondence points (yellow squares) are placed on matching features of the retina and cortex. Blue lines are placed on segments between correspondence points. They include blood vessels, vertical meridian (V1/V2) border, horizontal meridian, and the boundary between binocular and monocular cortex (measured in vivo at 72°). Warping of the retina onto the cortex produces a retinotopic map. Areal cortical magnification factor (mean ± SEM) for four cortices is graphed versus eccentricity.
Comment in
-
Blood vessels casting a shadow.Science. 2003 Mar 28;299(5615):1983-5; author reply 1983-5. doi: 10.1126/science.299.5615.1983. Science. 2003. PMID: 12663898 No abstract available.
References
Publication types
MeSH terms
Substances
Grants and funding
LinkOut - more resources
Full Text Sources
Other Literature Sources
Miscellaneous
