. 2002 Oct 29;99(22):14142-6.
doi: 10.1073/pnas.232276699. Epub 2002 Oct 17.

Electronic detection of DNA by its intrinsic molecular charge

Affiliations

Electronic detection of DNA by its intrinsic molecular charge

Jurgen Fritz et al. Proc Natl Acad Sci U S A. .

Abstract

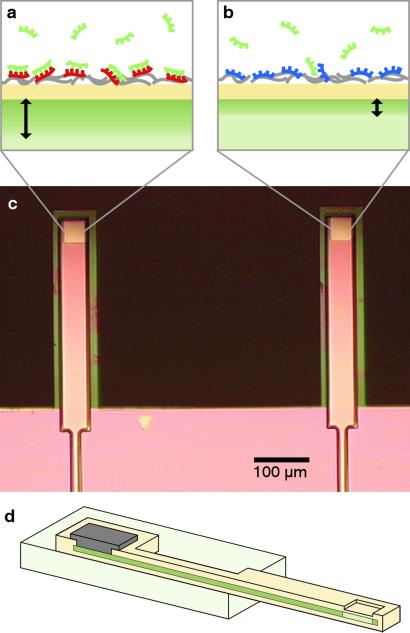
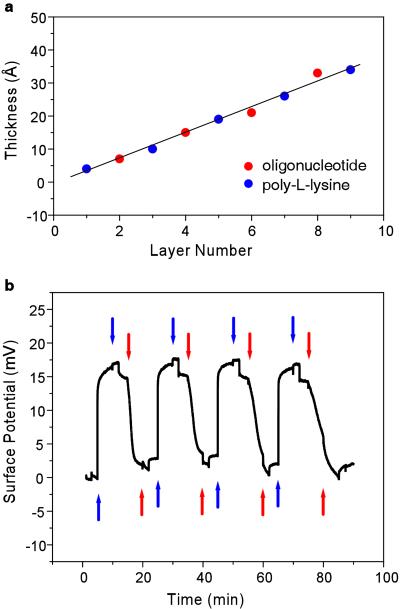
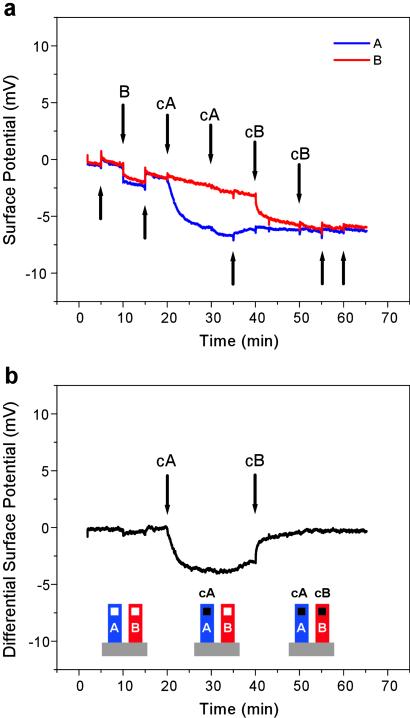
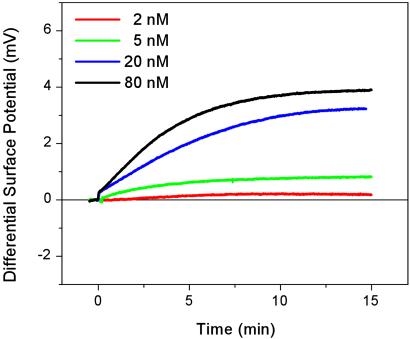
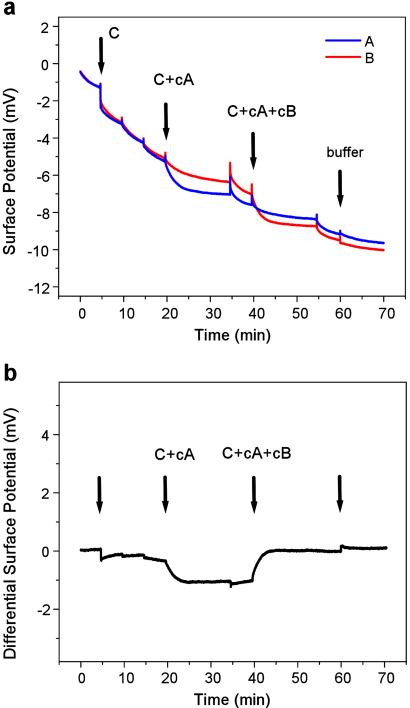
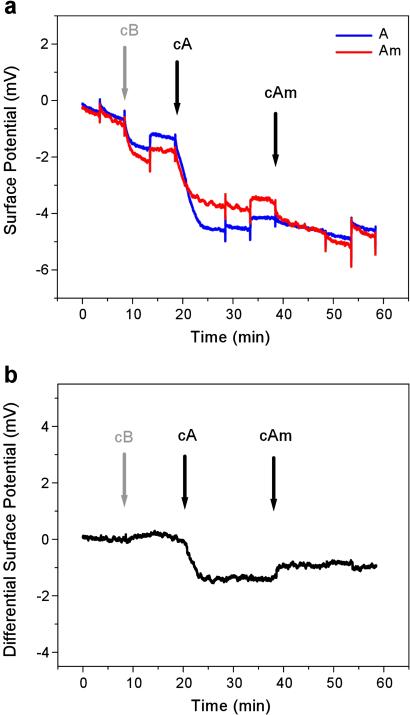
We report the selective and real-time detection of label-free DNA using an electronic readout. Microfabricated silicon field-effect sensors were used to directly monitor the increase in surface charge when DNA hybridizes on the sensor surface. The electrostatic immobilization of probe DNA on a positively charged poly-l-lysine layer allows hybridization at low ionic strength where field-effect sensing is most sensitive. Nanomolar DNA concentrations can be detected within minutes, and a single base mismatch within 12-mer oligonucleotides can be distinguished by using a differential detection technique with two sensors in parallel. The sensors were fabricated by standard silicon microtechnology and show promise for future electronic DNA arrays and rapid characterization of nucleic acid samples. This approach demonstrates the most direct and simple translation of genetic information to microelectronics.


Figures

Fig 1.
Fig 1.
Sensor schematics. (a and b) EIS interface of a n-type field-effect sensor. DNA exhibits one intrinsic negative charge per base at its sugar-phosphate backbone. Probe DNA is bound electrostatically to a layer of PLL (gray) on the surface. (a) Binding of negatively charged target DNA (green) to its complementary probe DNA (red) at the sensor surface (yellow) extends the depletion region (black arrow) in the silicon portion of the sensor compared with b, where no binding occurs to noncomplementary probe DNA (blue). (c) Optical micrograph of a device consisting of field-effect sensors at the terminus of two cantilevers. The cantilevers are 500 μm long, 75 μm wide, and 3 μm thick. (d) Cross section of a cantilever field-effect sensor. The sensing area at the terminus of the cantilever is connected electrically to a metal contact on the substrate by a layer of highly doped silicon inside the cantilever.
Fig 2.
Fig 2.
PLL/oligonucleotide multilayer growth. (a) Thickness of PLL/oligonucleotide multilayer from ellipsometry measurements on silicon substrates that were prepared identically to the field-effect sensor surfaces. The thickness increases linearly. (b) Surface potential signal of multilayer growth in solution measured with a field-effect sensor. The signal alternates according to the charge of the adsorbed layer (positive for PLL and negative for oligonucleotides). The same PLL and oligonucleotide concentrations as described for a were used. Each solution was injected twice and followed by an injection of buffer before the next layer was adsorbed. Blue arrows indicate PLL injections, and red arrows indicate oligonucleotide injections.
Fig 3.
Fig 3.
Field-effect detection of DNA hybridization. (a) Surface potential response from sensor 1 (blue) functionalized with probe oligonucleotide A and sensor 2 (red) functionalized with probe oligonucleotide B during a hybridization experiment. Downward arrows indicate injections of oligonucleotides, and upward arrows indicate injections of buffer into the fluid cell. (b) Differential signal obtained by subtracting the two sensor signals shown in a (sensor 1-sensor 2). The order of injections was: buffer, B (80 nM), buffer, cA (80 nM), cA (200 nM), buffer, cB (80 nM), cB (200 nM), and buffer. The second injection of either cA or cB did not result in a change in hybridization signal, indicating that saturation was reached.
Fig 4.
Fig 4.
Concentration dependence and detection limit. Shown is the differential surface potential response for the hybridization of target oligonucleotides at concentrations of 2, 5, 20, and 80 nM.
Fig 5.
Fig 5.
Field-effect detection within a complex sample. Absolute surface potential (a) and differential surface potential (b) for the hybridization of 20 nM oligonucleotides cA to A and cB to B within a 10-times-higher concentration of unrelated oligonucleotides. All injections were made at a constant 200 nM concentration. Arrows indicate injections of 200 nM C, then 20 nM cA + 180 nM C, and then 20 nM cB + 20 nM cA + 160 nM C.
Fig 6.
Fig 6.
Field-effect detection of a single base mismatch. Surface potentials from two sensors that were functionalized with probe oligonucleotides A and Am, which differ only in a single base. Control solutions with noncomplementary target oligonucleotide cB show no differential signal, whereas injection of 80 nM of complementary sequences cA and cAm both show a distinct hybridization signal. (a) Absolute surface potential. (b) Differential surface potential.

References

    1. Lander E. S. (1999) Nat. Genet. 21, Suppl. 1, 3-4. - PubMed
    1. Wang J. (2000) Nucleic Acids Res. 28, 3011-3016. - PMC - PubMed
    1. Kricka L. J. (1999) Clin. Chem. 45, 453-458. - PubMed
    1. Wang J. (1999) Chem. Eur. J. 5, 1681-1685.
    1. Castro A. & Williams, J. G. K. (1997) Anal. Chem. 69, 3915-3920. - PubMed

Publication types

LinkOut - more resources