. 2003 Jan;284(1):H56-65.
doi: 10.1152/ajpheart.00577.2002. Epub 2002 Sep 12.

RV functional imaging: 3-D echo-derived dynamic geometry and flow field simulations

Affiliations

RV functional imaging: 3-D echo-derived dynamic geometry and flow field simulations

Ares D Pasipoularides et al. Am J Physiol Heart Circ Physiol. 2003 Jan.

Abstract

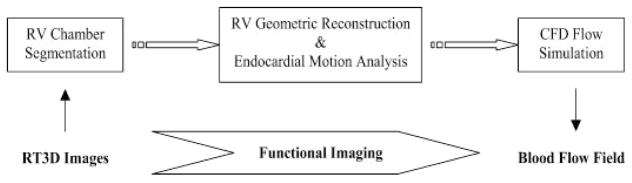
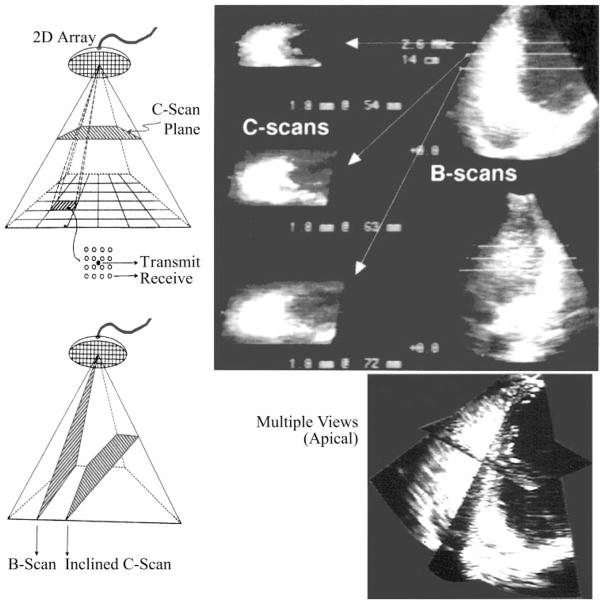
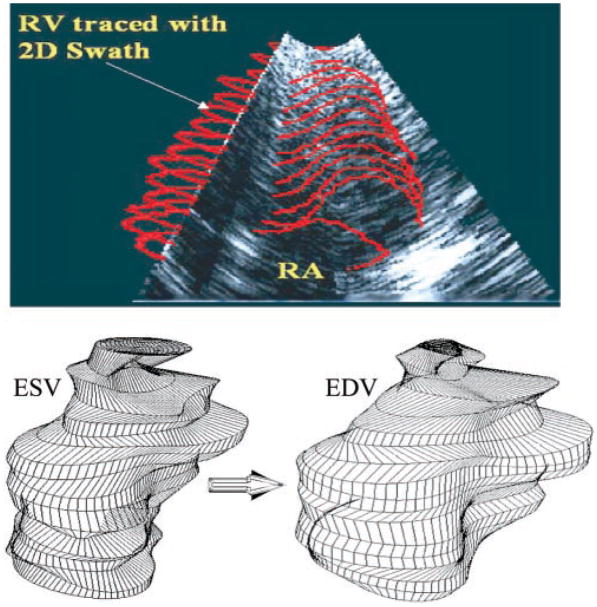
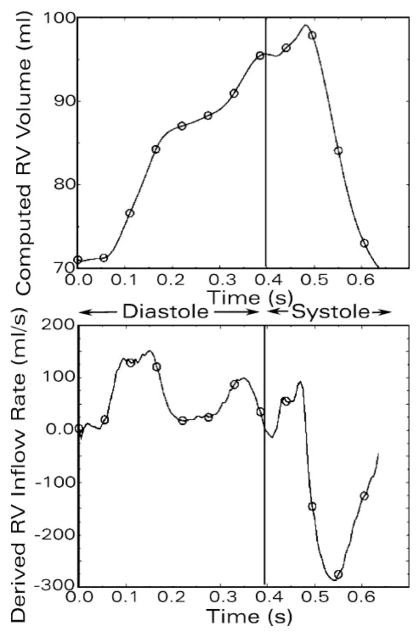
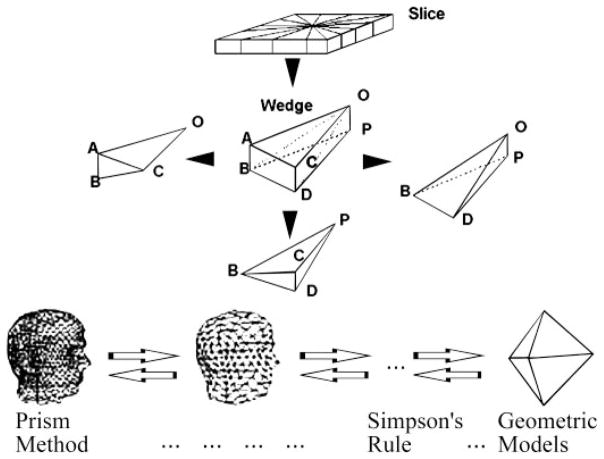
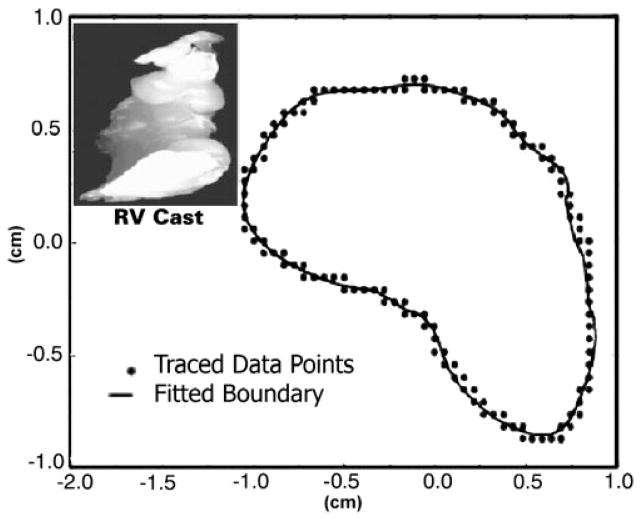
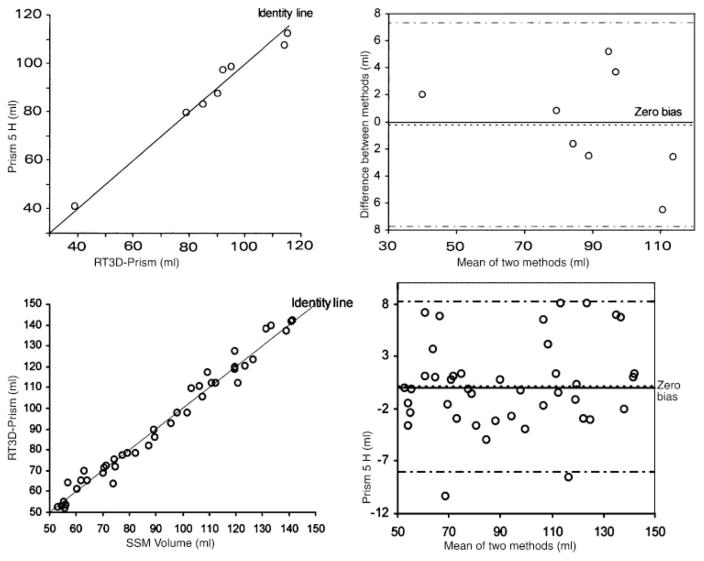
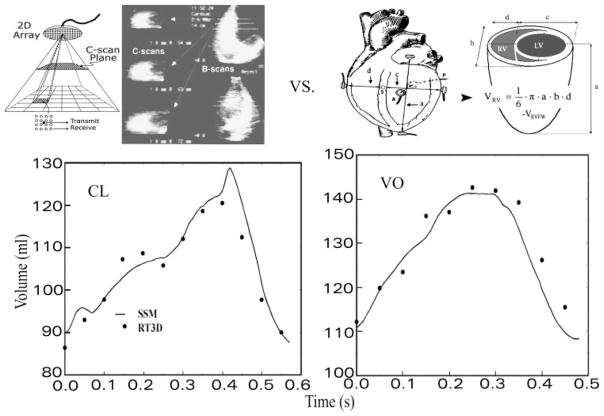
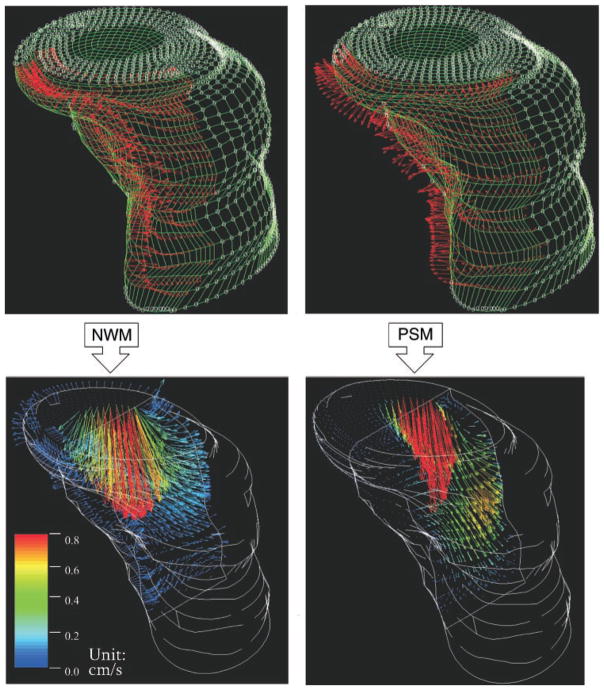
We describe a novel functional imaging approach for quantitative analysis of right ventricular (RV) blood flow patterns in specific experimental animals (or humans) using real-time, three-dimensional (3-D) echocardiography (RT3D). The method is independent of the digital imaging modality used. It comprises three parts. First, a semiautomated segmentation aided by intraluminal contrast medium locates the RV endocardial surface. Second, a geometric scheme for dynamic RV chamber reconstruction applies a time interpolation procedure to the RT3D data to quantify wall geometry and motion at 400 Hz. A volumetric prism method validated the dynamic geometric reconstruction against simultaneous sonomicrometric canine measurements. Finally, the RV endocardial border motion information is used for mesh generation on a computational fluid dynamics solver to simulate development of the early RV diastolic inflow field. Boundary conditions (tessellated endocardial surface nodal velocities) for the solver are directly derived from the endocardial geometry and motion information. The new functional imaging approach may yield important kinematic information on the distribution of instantaneous velocities in the RV diastolic flow field of specific normal or diseased hearts.


Figures

Fig. 1
Fig. 1
Flowchart of the functional imaging method. Input to the algorithm is a series of real-time, three-dimensional (3-D) echocardiography (RT3D) images of the right ventricular (RV) chamber, and the output is the corresponding blood flow velocity field in the right ventricle. CFD, computational fluid dynamics.
Fig. 2
Fig. 2
RT3D imaging illustrating B-mode and C-mode simultaneous views within the subpyramidal scanned volume. Stop-frame contemporaneous RV images are shown after intraluminal contrast medium injection for endocardial border enhancement before image segmentation.
Fig. 3
Fig. 3
Top: RV endocardial border of each C-mode slice is traced manually as a closed loop representing an initial guess. Two-dimensional (2-D) “swath” border detection algorithm then adjusts the initial guess so that the border falls on the “most likely position” and allows visualization of the stack of 2-D contours of each RT3D frame using the B-mode, as pictured. Bottom: representative end-systolic (ESV) and end-diastolic (EDV) RV chamber reconstructions.
Fig. 4
Fig. 4
Continuous tracings of instantaneous RV chamber volume (top) by shell subtraction model (SSM) using sonomicrometric measurements, and its digitally obtained time derivative signal (bottom), (continuous lines). These instantaneous values were used for adjusting the RT3D-derived volume and velocity boundary conditions in successive 2.5-ms intervals before their use in the CFD simulations of the RV diastolic flow field. Representative adjusted points corresponding to the original RT3D data, and the associated rate of volume change (dV/dt) values are superposed (open circles) on the SSM-derived tracings of RV chamber volume and its time derivative.
Fig. 5
Fig. 5
Schematic diagram illustrating the volumetric prism method. Algorithm is an adaptation of the Archimedean “method of exhaustion” for computing volumes of various geometric objects. Unlike abstract geometric solids and “disk summation” using Simpson’s or other integral algorithms, the vertices of the tetrahedral tessellation can accurately follow endocardial surface details corresponding to local “features” (bottom).
Fig. 6
Fig. 6
2-D Fourier series curve fit of the traced endocardial points (x- and y-coordinates) of a representative RV cast layer. Fourier series representation allows for a uniform number of data points in each successive layer and smoothes the boundary. Smoothing reduces noise inherent in the data collection and tracing process. Inset: typical RV cast.
Fig. 7
Fig. 7
Top: Bland-Altman plots demonstrating agreement between volumes obtained by the prism method (left) on geometric reconstructions of RV chamber casts and direct water displacement. Note closeness of data points to the identity line and the near-zero bias and narrow 95% confidence interval bounds (right). Bottom: Bland-Altman plots showing close agreement between the dynamic RV chamber volumes (prism method) reconstructed using RT3D data and the SSM volumes in awake dogs (pooled control and volume overload data) (left). Note closeness of data points to the identity line and the near-zero bias with tight 95% confidence intervals (right).
Fig. 8
Fig. 8
RV instantaneous volumes calculated noninvasively by the prism model for chamber geometric reconstructions using RT3D serial chamber reconstructions (top left) agree closely with those using the SSM under control conditions (CL) and chronic volume overload (VO) (bottom). Also shown are instrumentation and measurements needed for application of the SSM (top right); VRVFW is the RV free wall volume determined by water displacement during autopsy.
Fig. 9
Fig. 9
Functional imaging of commencing RV inflow using RT3D imaging data, under normal wall motion (NWM) conditions and during volume overload with paradoxic diastolic septal motion (PSM). Top: external (endocardial) surface nodes of instantaneous computational meshes and application of boundary conditions (red velocity vectors on endocardial surface nodes). Only velocity vectors on the septal border of each RV mesh are shown to avoid clutter. Septal nodal velocity vectors (red) point toward RV chamber and free wall in the normal case but toward the left ventricle with PSM. Bottom: median sagittal (anteroposterior) plane “cuts” of the resulting velocity fields at the very start (≈10 ms from onset) of the E-wave. With NWM there is blood flow toward the free wall in the septal region, whereas with PSM there is very little blood flow in that region. Note the different velocity profiles at the tricuspid orifice, and the abrupt transition (deceleration) from red-yellow-green to black in the dilated chamber (PSM) compared with the more gradual transition through blue hues in the normal.

Similar articles

Cited by

References

    1. Axel L. Physics and technology of cardiovascular MR imaging. Cardiol Clin. 1998;16:125–133. - PubMed
    1. Bauman RP, Rembert JC, Greenfield JC., Jr Myocardial blood flow in awake dogs with chronic tricuspid regurgitation. Basic Res Cardiol. 1998;93:63–69. - PubMed
    1. Bird JJ, Murgo JP, Pasipoularides A. Fluid dynamics of aortic stenosis: subvalvular gradients without subvalvular obstruction. Circulation. 1982;66:835–840. - PubMed
    1. Bland JM, Altman DG. Comparing methods of measurement: why plotting difference against standard method is misleading. Lancet. 1995;346:1085–1087. - PubMed
    1. Bland JM, Altman DG. Measuring agreement in method comparison studies. Stat Methods Med Res. 1999;8:135–160. - PubMed

Publication types

LinkOut - more resources