. 2002 Oct 15;22(20):8797-807.
doi: 10.1523/JNEUROSCI.22-20-08797.2002.

Synaptic vesicle depletion correlates with attenuated synaptic responses to prolonged repetitive stimulation in mice lacking alpha-synuclein

Affiliations

Synaptic vesicle depletion correlates with attenuated synaptic responses to prolonged repetitive stimulation in mice lacking alpha-synuclein

Deborah E Cabin et al. J Neurosci. .

Abstract

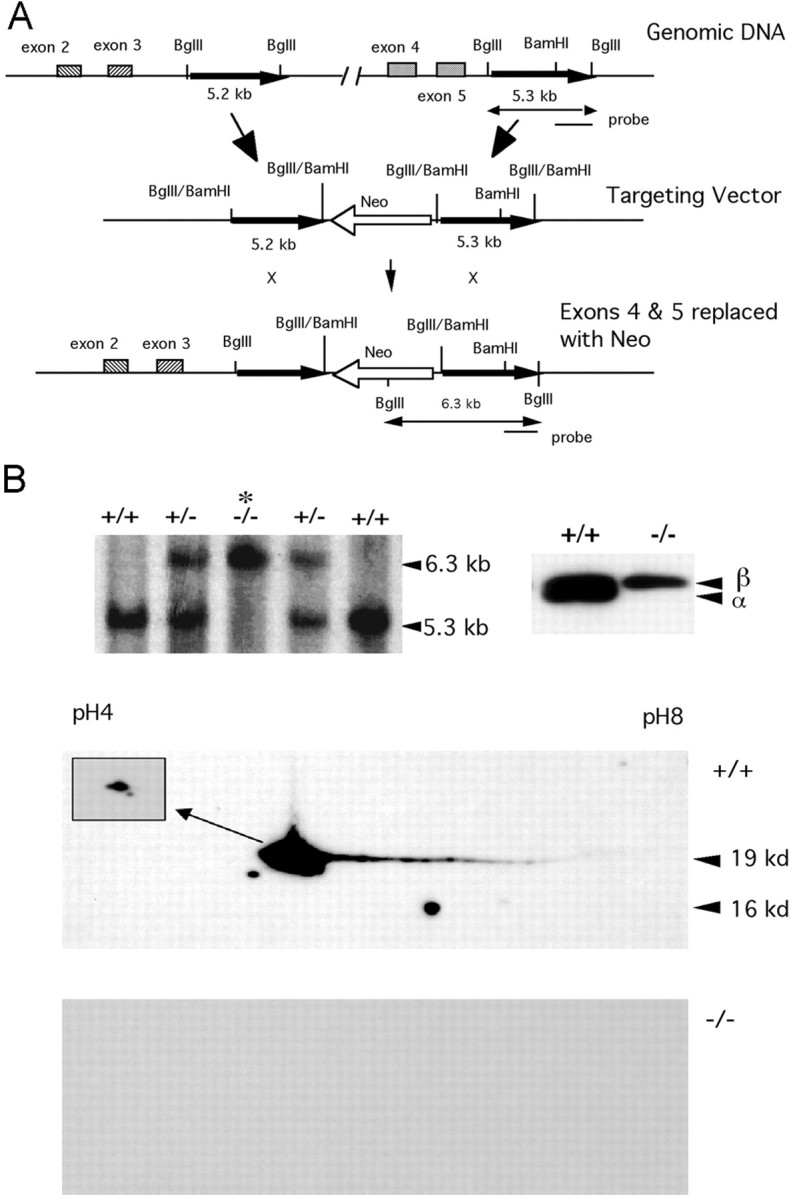
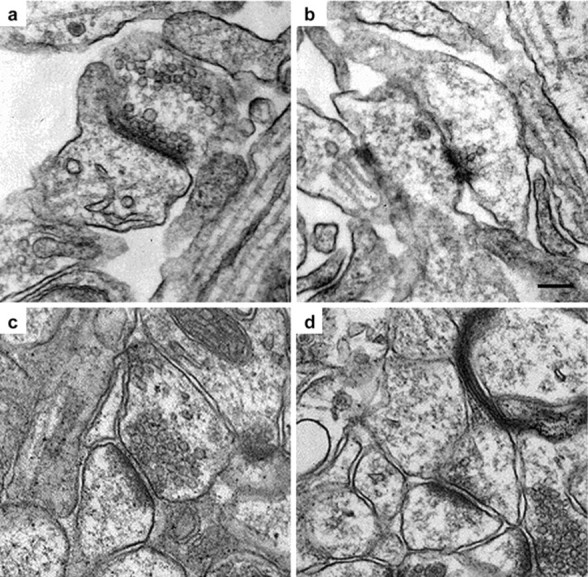
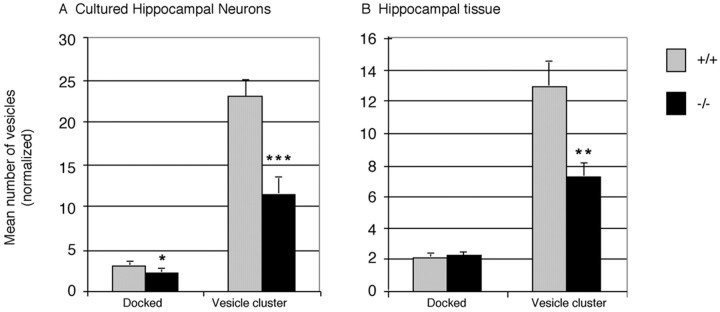
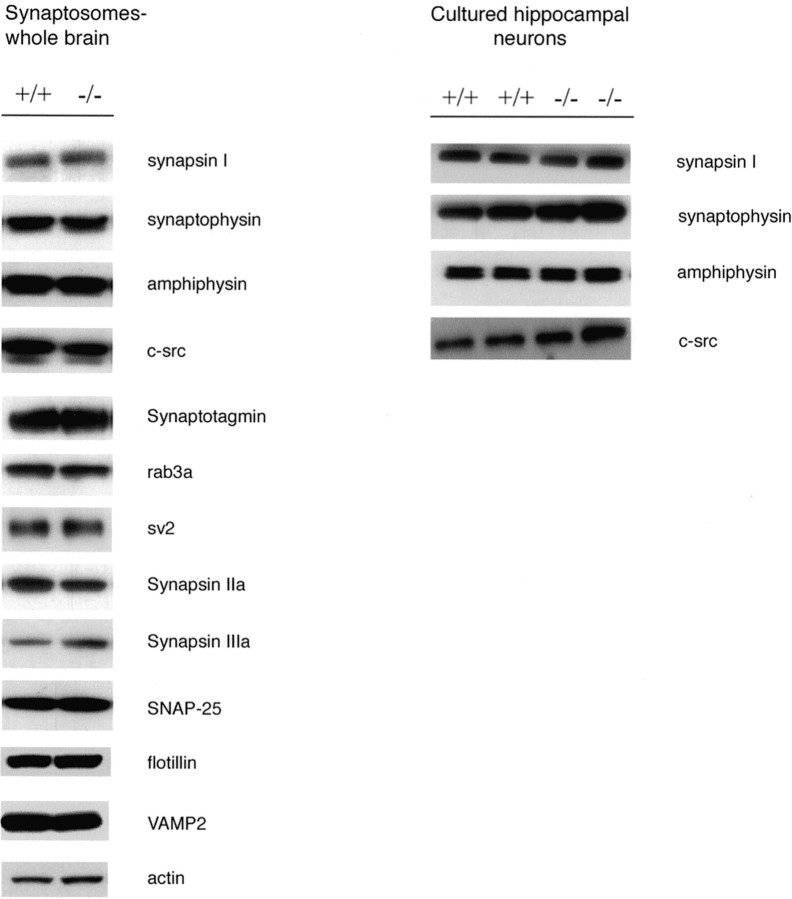
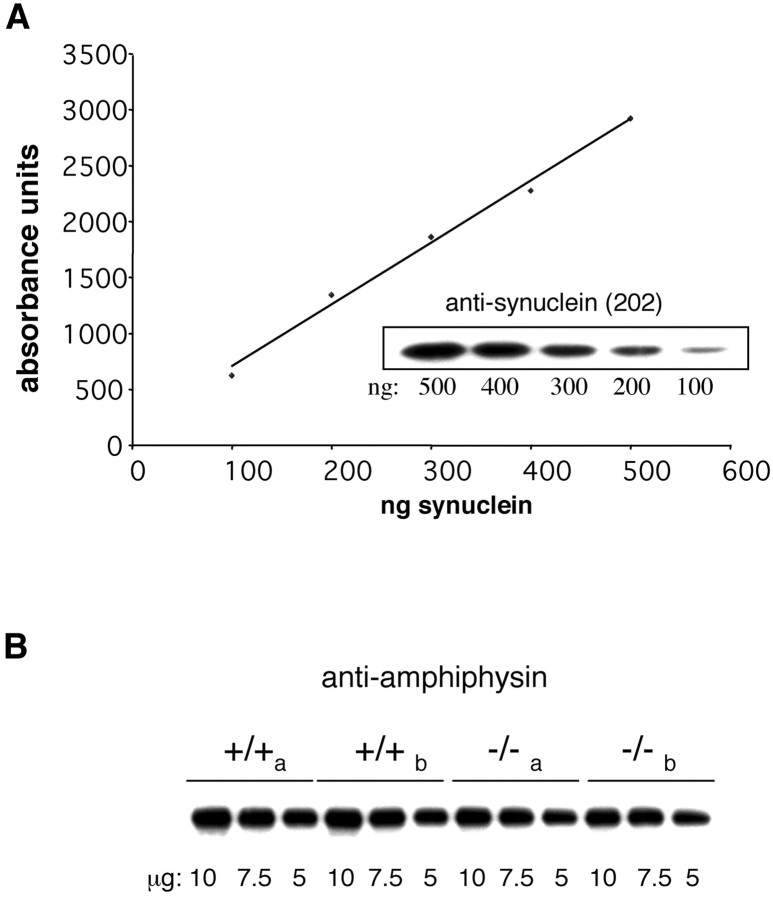
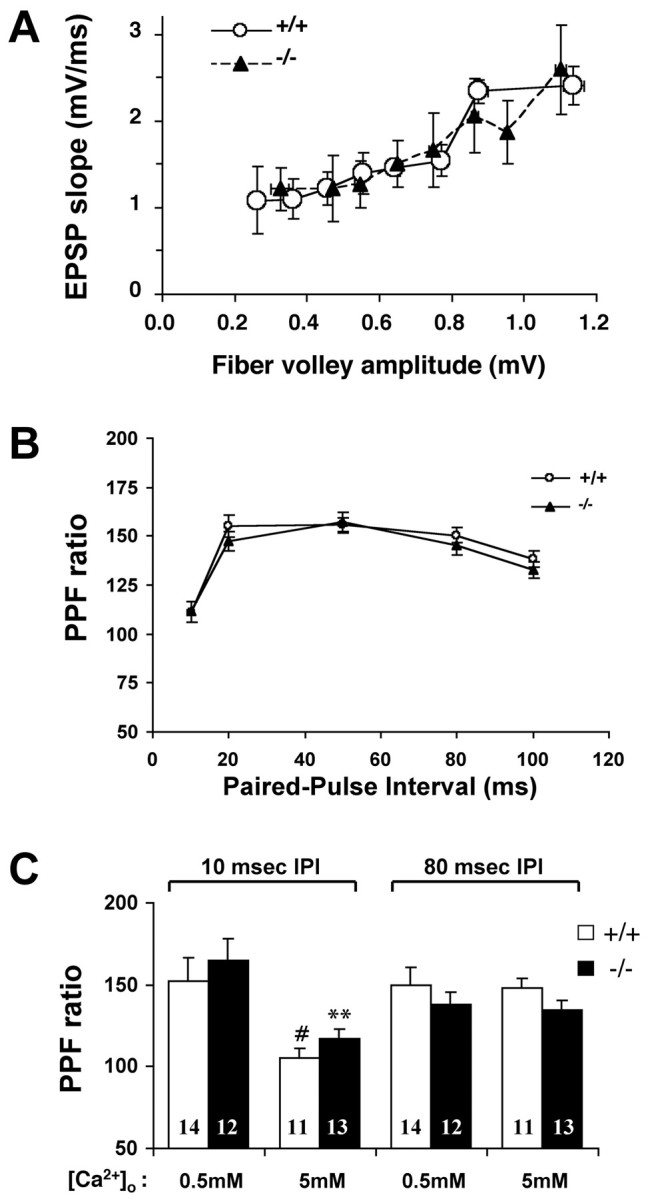
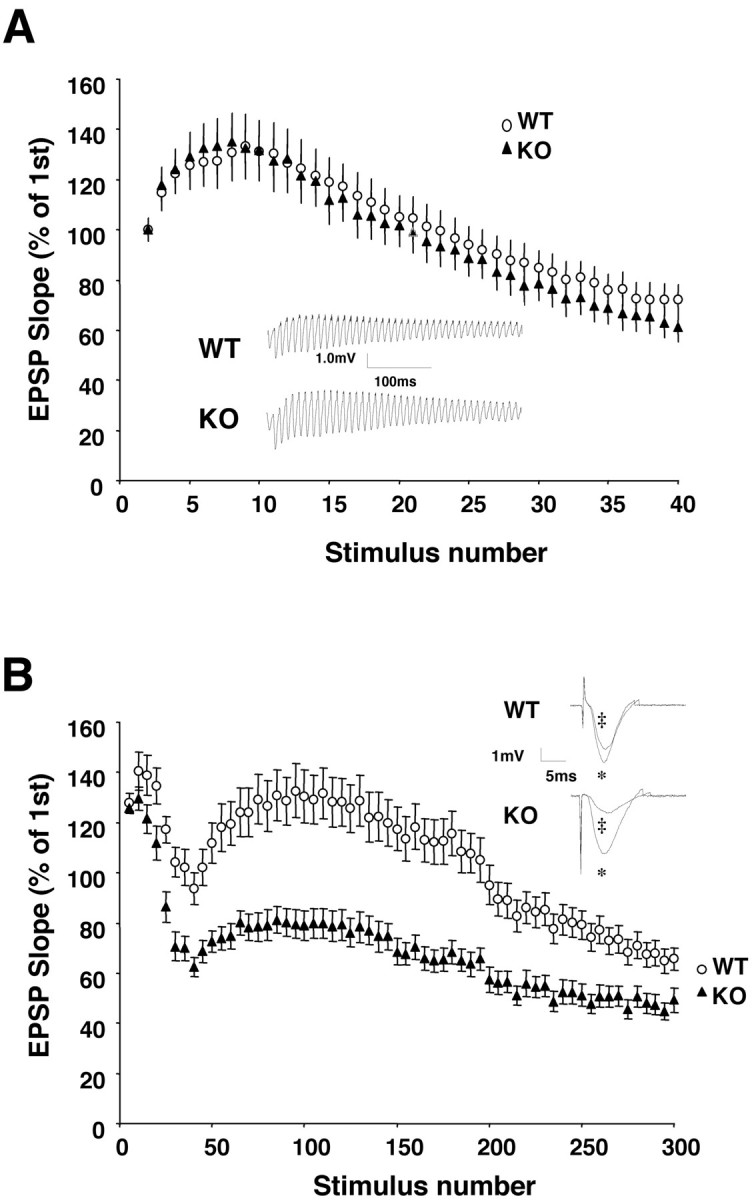
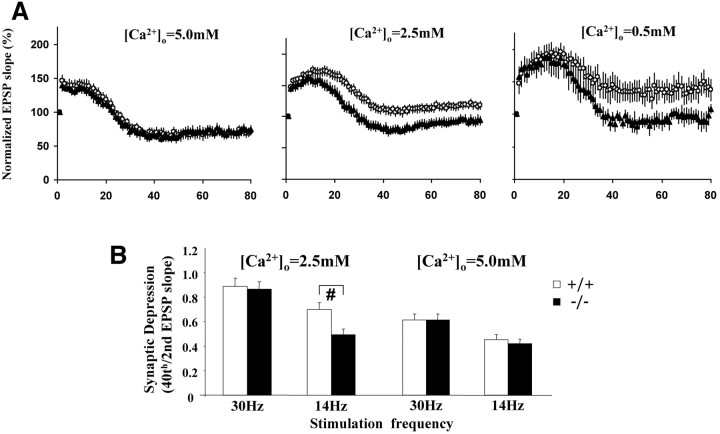
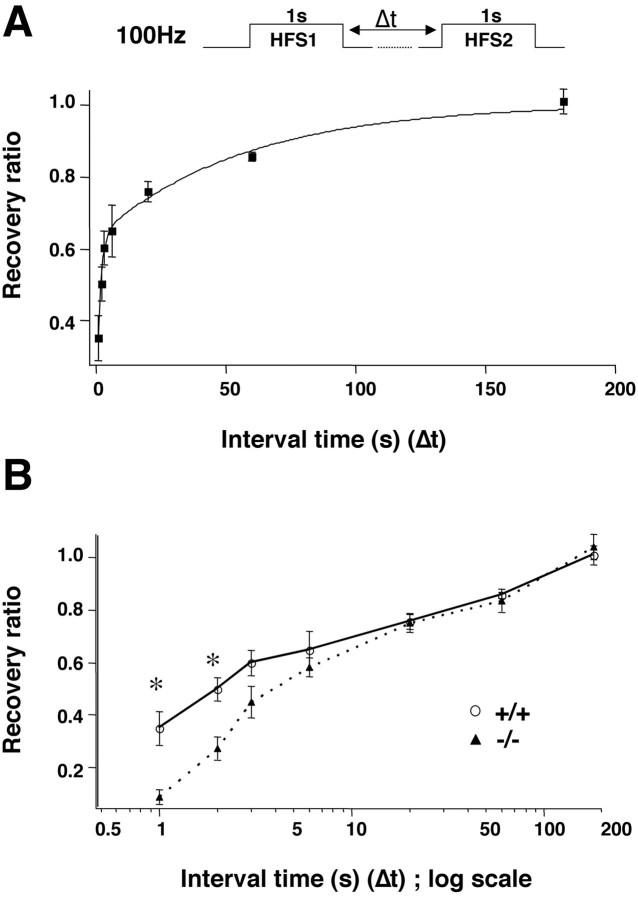
Although the mutation of alpha-synuclein, a protein associated with presynaptic vesicles, is implicated in the etiology and pathogenesis of Parkinson's disease, the biological function of the normal protein is unknown. Mice that lack alpha-synuclein have been generated by homologous recombination in embryonic stem cells. Electron microscopic examination of hippocampal synapses revealed a striking selective deficiency of undocked vesicles without affecting docked vesicles. Field recording of CA1 synapses in hippocampal slices from the mutant mice demonstrated normal basal synaptic transmission, paired-pulse facilitation, and response to a brief train of high-frequency stimulation (100 Hz, 40 pulses) that exhausts only docked vesicles. In contrast, the alpha-synuclein knock-out mice exhibited significant impairments in synaptic response to a prolonged train of repetitive stimulation (12.5 Hz, 300 pulses) capable of depleting docked as well as reserve pool vesicles. Moreover, the replenishment of the docked vesicles by reserve pool vesicles after depletion was slower in the mutant synapses. Thus, alpha-synuclein may be required for the genesis and/or maintenance of a subset of presynaptic vesicles, those in the "reserve" or "resting" pools. These results reveal, for the first time, the normal function of endogenous alpha-synuclein in regulating synaptic vesicle mobilization at nerve terminals.


Figures

Fig. 1.
Fig. 1.
Generation of α-synuclein null mice.A, A targeting vector was constructed to replaceSnca exons 4 and 5 with Neo. B, Proper targeting was assessed by Southern blotting of genomic DNAs digested with BglII. b,Top left,Genomic Southern blot hybridization of BglII-digested genomic DNAs from a heterozygote intercross. All possible genotypes are seen. c,Top right, Western blot of brain homogenates from Snca+/+ andSnca−/− mice, using a polyclonal antibody that recognizes both α- and β-synuclein. A doublet in theSnca+/+ lane shows both α- and β-synuclein, whereas homozygousSnca−/− mice lack α-synuclein.Bottom, Western blot of total brain protein separated by two-dimensional PAGE and probed using a monoclonal antibody specific for α-synuclein. The top panel, from a wild-type (Snca+/+) mouse, demonstrates a number of isoforms of α-synuclein that differ slightly in isoelectric focus pI and molecular weight. All isoforms are missing in theSnca−/− mouse, indicating that the deletion allele eliminates expression of all protein isoforms of α-synuclein.
Fig. 2.
Fig. 2.
a, b, Cultured neurons from the hippocampus of 17.5 d post coitum fetal mice.a, Wild-type Snca+/+;b, knock-out Snca−/−synapses. c, d, Hippocampal synapses in brain sections from 2-month-old Snca+/+ andSnca−/− mice. Spinous synapses were photographed from primarily the CA1 region of hippocampus.c, Wild-type Snca+/+;d, knock-out Snca−/−synapses. The synapses measured were those in which a well defined postsynaptic density was observed. Scale bar, 100 nm.
Fig. 3.
Fig. 3.
Average number of vesicles in the docked (active zone) pool and in the vesicle cluster, located more than one vesicle diameter from the synapse. A, Average number of vesicles in synapses from Snca+/+ andSnca−/− hippocampal neuronal cultures; n = 61 from each genotype.B, Average number of vesicles in synapses fromSnca+/+ andSnca−/− hippocampal brain samples;n = 131 from each genotype. Significance for differences in mean between Snca+/+and Snca−/−: *p= 0.026, **p = 0.00025, ***p = 0.00015, Student's two-sided t test,.
Fig. 4.
Fig. 4.
Western blot analysis of synaptic proteins from wild-type (Snca+/+) and knock-out (Snca−/−) mouse brains for a battery of synaptic proteins. Ten micrograms of total protein from synaptosome fractions made from brain homogenates or 30 μg of total protein from a postnuclear supernatant from cultured hippocampal neurons were loaded in each well and probed with antibodies against each of the proteins indicated.
Fig. 5.
Fig. 5.
Quantitative immunoblot analysis of synaptosomes from control and Snca−/− mice.A, Known amounts of recombinant α-synuclein (100–500 ng) were separated by SDS-PAGE and subjected to immunoblot analysis with the anti-synuclein antibody 202 (inset). Detection was with HRP-labeled secondary antibodies and development by enhanced chemiluminescence. A standard curve of band intensity versus the amount of protein generates a linear curve. B, A representative example of the immunoblot intensity data used to generate the ratios in Table 1. Dilutions of synaptosome fractions purified from two brains from independent (a, b)Snca+/+ mice and two independent (a, b) Snca−/− mice were analyzed on each blot to control for intergel variability and were immunoblotted with anti-amphiphysin antibody.
Fig. 6.
Fig. 6.
Normal basal synaptic transmission and PPF at hippocampal synapses in α-synuclein knock-out mice. Field EPSPs were recorded at CA1 synapses by stimulating the Schaffer collaterals. Data from multiple recordings of the same genotype were pooled and expressed as means ± SEM. A, Input–output curves forSnca+/+ (n = 12 slices) and Snca−/−(n = 14 slices) mice. The mean slope of EPSPs is plotted against fiber volley amplitudes. Because fiber volley amplitudes are not fixed numbers, we also expressed fiber volley as mean ± SEM. B, Plot of PPFs inSnca+/+ (n = 36 slices) and Snca−/−(n = 32 slices) mice. The ratios of the second and first EPSP slopes were calculated, and mean values are plotted against different interpulse intervals (10–100 msec). C, Effect of [Ca2+]o PPF at different IPIs. PPFs at short (10 msec IPI) and long (80 msec IPI) were measured at 0.5 and 5 mm[Ca2+]o in bothSnca+/+ andSnca−/− synapses. The number associated with each column represents the number of slices used. Note that PPF ratios at IPIs of 10 msec, but not IPIs of 80 msec, are significantly different. #p < 0.05, **p < 0.001, Student's t test. No statistical differences are found in PPF ratios betweenSnca+/+ andSnca−/− synapses in any conditions.
Fig. 7.
Fig. 7.
Role of α-synuclein in synaptic responses to repetitive stimulation. The slopes of field EPSPs during the entire recording were normalized to the first EPSP slope in each recording.A, Normal synaptic responses to a brief HFS (100 Hz, 40 pulses) at α-synuclein synapses. Representative recordings of entire EPSP traces from wild-type (WT) and knock-out (KO) hippocampus are shown in the inset.Stimulus artifacts were removed to clarify each EPSP waveform.B, Impaired responses to a PRS (300 stimuli at 12.5 Hz) in Snca−/− synapses. Time course of the effects of a stimulus train are shown. Representative single EPSPs at one-tenth (*) stimulus and one-hundredth (‡) stimulus are shown in the inset. Every five points of responses was averaged, and all EPSP slopes were normalized to the first EPSP slope.
Fig. 8.
Fig. 8.
Relationship between α-synuclein and Ca2+ in synaptic responses to PRS. Synaptic depression was induced at CA1 synapses by PRS (14 Hz) in the presence of the NMDA antagonist dl-APV (100 μm). A, Effect of [Ca2+]o on synaptic depression. The slopes of field EPSPs during the entire recording were normalized to the first EPSP slope in each recording. The mean EPSP slopes are plotted against the number of stimuli (1st to 80th pulses) at low (0.5 mm), normal (2.5 mm), and high (5.0 mm) [Ca2+]o, inSnca+/+ (n = 9, 22, and 9) and Snca−/−(n = 6, 17, and 9) synapses, respectively.B, Effect of stimulation frequency on synaptic depression. Synaptic depression was induced by PRS and was expressed as the ratio of the 40th and 2nd EPSP slopes. The same slices were used for both 14 and 30 Hz PRS experiments. White columns, Data obtained in normal (2.5 mm) [Ca2+]o inSnca+/+ (n = 13) and Snca−/− (n = 14) slices. Black columns, Data obtained in high (5 mm) [Ca2+]o inSnca+/+ (n = 14) and Snca−/− (n = 16) slices.
Fig. 9.
Fig. 9.
Role of α-synuclein in the recovery of synaptic responses after depression. A, Time course of recovery after synaptic depression in wild-type synapses. Top,Stimulation protocol to study recovery. Synaptic depression was induced by a train of HFS (100 Hz, 1 sec); recovery from depression was monitored with another HFS started after a time lag (Δt). The relative recovery of synaptic response after depression at any given time (i) is presented by the ratio of the sum of the second response (X2iY) and the sum of the first response (X1Y), whereY is the offset (see Materials and Methods). The ratios (means ± SE, from multiple slices) were plotted as a function of Δt (n = 3 animals). The curve was fitted by the equation given in Materials and Methods, with the time constants τF = 1.28 sec and τS = 56.8 sec, f = 0.627. B, Recovery curves for WT and KO synapses. To better present the differences in recovery between WT and KO synapses, the relative recovery was plotted against Δt in log scale. *Significant difference from the WT; nonparametric Mann–Whitney U test,p < 0.01, n = 8–10 for each point.
Fig. 10.
Fig. 10.
Wild-type and Snca mutant mice show similar increases in locomotor activity in response to amphetamine. Injections of either saline or d-amphetamine were given at 30 min. Squares indicate spontaneous locomotor activity, circles indicate amphetamine-induced activity, open symbols represent the Sncamutant mice (n = 11), and closed symbols represent the wild-type mice (n = 11). The averages of total activity counts (light beam breaks) per 10 min interval are shown ± SEM. The mobile and static count time courses are similar, although reduced in magnitude to the total counts both with and without amphetamine.

References

    1. Abeliovich A, Schmitz Y, Farinas I, Choi-Lundberg D, Ho WH, Castillo PE, Shinsky N, Verdugo JM, Armanini M, Ryan A, Hynes M, Phillips H, Sulzer D, Rosenthal A. Mice lacking α-synuclein display functional deficits in the nigrostriatal dopamine system. Neuron. 2000;25:239–252. - PubMed
    1. Castro-Alamancos MA, Connors BW. Distinct forms of short-term plasticity at excitatory synapses of hippocampus and neocortex. Proc Natl Acad Sci USA. 1997;94:4161–4166. - PMC - PubMed
    1. Chin LS, Li L, Ferreira A, Kosik KS, Greengard P. Impairment of axonal development and of synaptogenesis in hippocampal neurons of synapsin I-deficient mice. Proc Natl Acad Sci USA. 1995;92:9230–9234. - PMC - PubMed
    1. Clayton DF, George JM. Synucleins in synaptic plasticity and neurodegenerative disorders. J Neurosci Res. 1999;58:120–129. - PubMed
    1. Davidson WS, Jonas A, Clayton DF, George JM. Stabilization of α-synuclein secondary structure upon binding to synthetic membranes. J Biol Chem. 1998;273:9443–9449. - PubMed

Publication types

MeSH terms