. 2002 Oct 15;22(20):9134-41.
doi: 10.1523/JNEUROSCI.22-20-09134.2002.

The origin and neuronal function of in vivo nonsynaptic glutamate

Affiliations

The origin and neuronal function of in vivo nonsynaptic glutamate

David A Baker et al. J Neurosci. .

Abstract

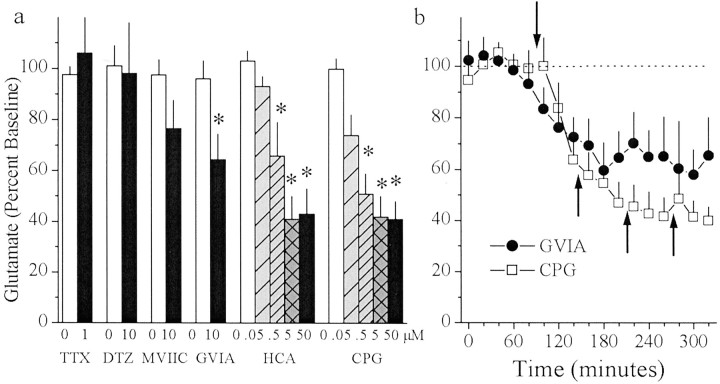
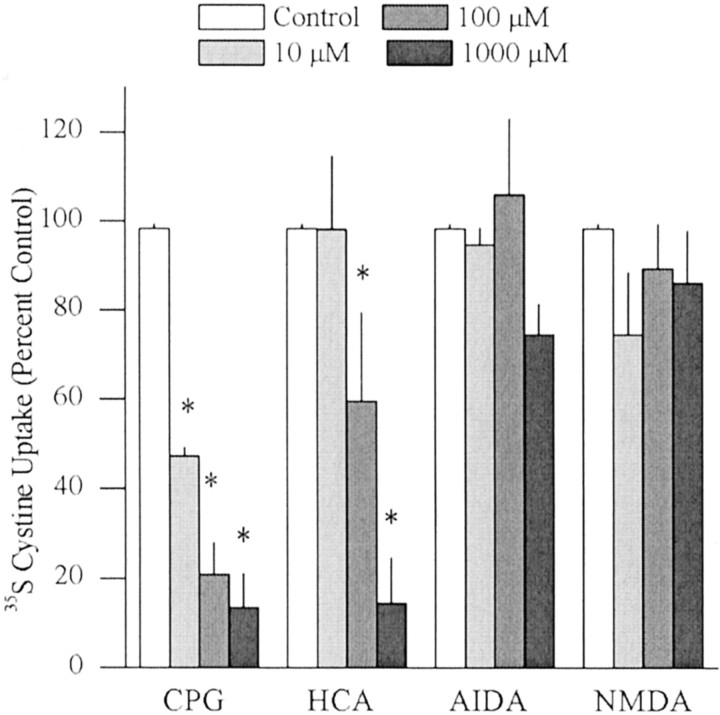
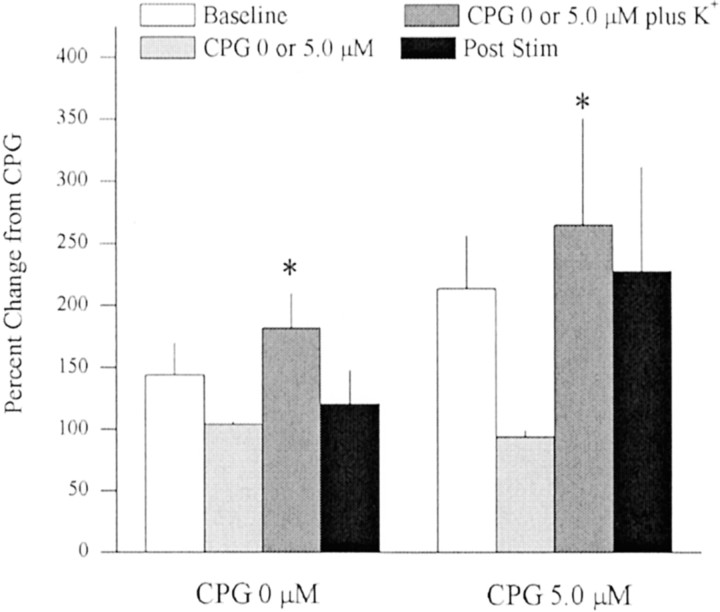
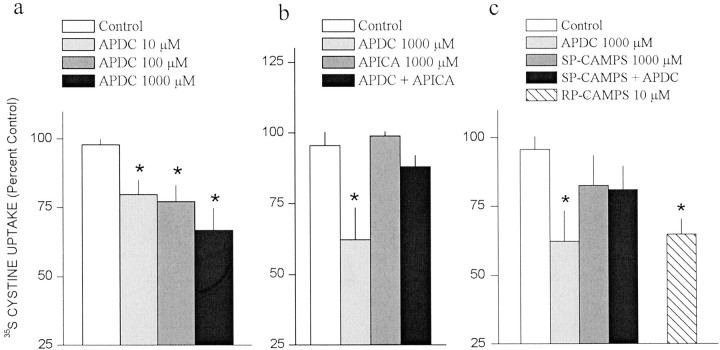
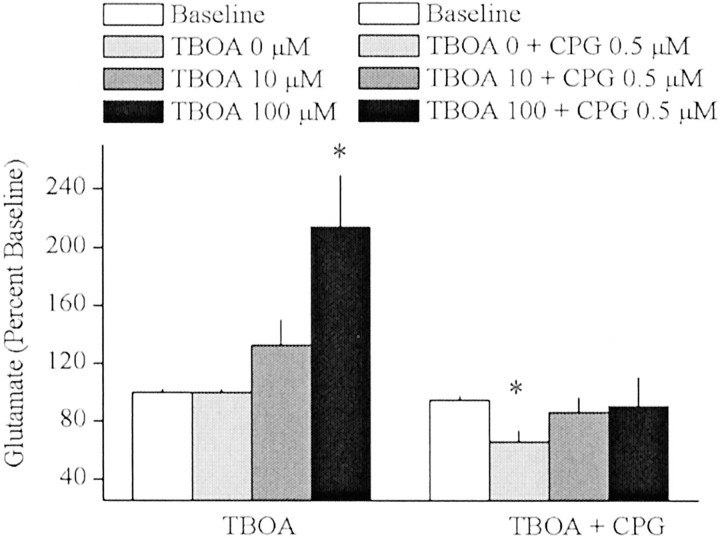
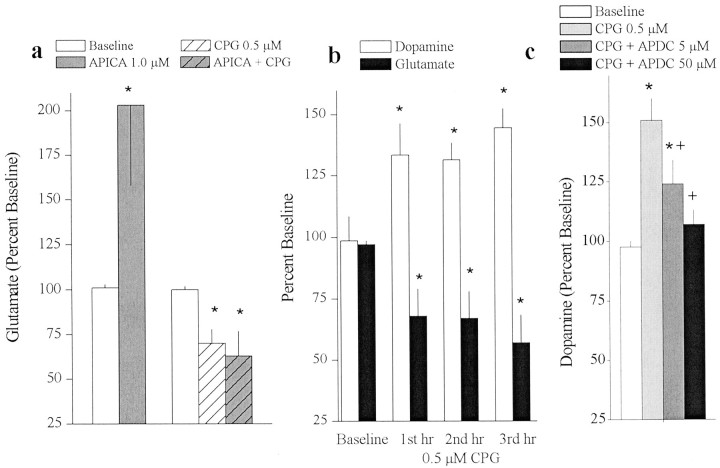
Basal extracellular glutamate sampled in vivo is present in micromolar concentrations in the extracellular space outside the synaptic cleft, and neither the origin nor the function of this glutamate is known. This report reveals that blockade of glutamate release from the cystine-glutamate antiporter produced a significant decrease (60%) in extrasynaptic glutamate levels in the rat striatum, whereas blockade of voltage-dependent Na+ and Ca2+ channels produced relatively minimal changes (0-30%). This indicates that the primary origin of in vivo extrasynaptic glutamate in the striatum arises from nonvesicular glutamate release by the cystine-glutamate antiporter. By measuring [35S]cystine uptake, it was shown that similar to vesicular release, the activity of the cystine-glutamate antiporter is negatively regulated by group II metabotropic glutamate receptors (mGluR2/3) via a cAMP-dependent protein kinase mechanism. Extracellular glutamate derived from the antiporter was shown to regulate extracellular levels of glutamate and dopamine. Infusion of the mGluR2/3 antagonist (RS)-1-amino-5-phosphonoindan-1-carboxylic acid (APICA) increased extracellular glutamate levels, and previous blockade of the antiporter prevented the APICA-induced rise in extracellular glutamate. This suggests that glutamate released from the antiporter is a source of endogenous tone on mGluR2/3. Blockade of the antiporter also produced an increase in extracellular dopamine that was reversed by infusing the mGluR2/3 agonist (2R,4R)-4-aminopyrrolidine-2,4-dicarboxlylate, indicating that antiporter-derived glutamate can modulate dopamine transmission via mGluR2/3 heteroreceptors. These results suggest that nonvesicular release from the cystine-glutamate antiporter is the primary source of in vivo extracellular glutamate and that this glutamate can modulate both glutamate and dopamine transmission.


Figures

Fig. 1.
Fig. 1.
In vivo microdialysis was used to sample extrasynaptic glutamate in the striatum before and after reverse dialysis of the Na+-channel blocker TTX (n = 9), the L-type Ca2+ channel blocker diltiazem (n = 7), the P/Q-type Ca2+ channel blocker MVIIC (n = 6), the N-type Ca2+ channel blocker GVIA (n = 8), or the cystine–glutamate antiporter inhibitors HCA (n = 6) and CPG (n = 7). a, Data are presented as mean (± SEM) glutamate (percentage of baseline levels) from samples collected during baseline (100 min) or at each drug concentration (60 min/concentration). b, Data from a are presented as glutamate across 20 min samples for rats receiving GVIA (0 or 10 μm) or CPG (0, 0.05, 0.5, 5.0, and 50 μm). The downward pointing arrow indicates the beginning of the infusion of GVIA or CPG. Upward pointing arrows indicate increases in CPG concentration as described ina. A one-way ANOVA on glutamate levels indicated a significant effect of drug concentration for GVIA (F(1,5) = 6.75; p< 0.05), HCA (F(4,20) = 10.19;p < 0.05), and CPG (F(4,24) = 18.64; p< 0.05). *p < 0.05, compared with baseline levels difference from baseline (Fisher's LSD post hocanalysis).
Fig. 2.
Fig. 2.
CPG and HCA directly block the cystine–glutamate antiporter. The uptake of [35S]cystine in striatal tissue slices incubated was measured in the presence and absence of CPG, HCA, the group I mGluR antagonist AIDA, or NMDA (N = 4/drug). Data are presented as [35S]cystine uptake in the presence of inhibitors expressed as percentage of change of [35S]cystine uptake in the absence of inhibitors. A one-way ANOVA on [35S]cystine uptake indicated a significant effect of drug concentration for CPG (F(3,9) = 47.23; p < 0.05) and HCA (F(3,9) = 15.74; p< 0.05) . *p < 0.05, difference from [35S]cystine uptake in the absence of inhibitors (Fisher's LSD post hoc analysis).
Fig. 3.
Fig. 3.
In vivo microdialysis was used to sample extrasynaptic glutamate in the striatum after reverse dialysis of K+ alone (i.e., 0 μm CPG + K+; n = 8) or after reverse dialysis of 5.0 μm CPG followed by 5.0 μmCPG plus K+ (80 mm;n = 8). Mean extracellular glutamate levels (± SEM) in the 0 μm CPG experiment were 1.83 ± 0.36 μm during baseline and 1.52 ± 0.28 μmduring 0 μm CPG. The decrease in extracellular glutamate during the 0 μm CPG treatment was not significantly different from baseline and was essentially caused by a single rat that exhibited stable basal levels but exhibited a drop in glutamate while switching dialysis buffer. In the 5.0 μm CPG experiment, extracellular glutamate levels were 2.01 ± 0.41 μmduring baseline and 1.33 ± 0.24 during 5.0 μm CPG. Because 5.0 μm CPG lowered extracellular glutamate levels, the data presented are normalized to glutamate levels at 0 or 5.0 μm CPG. A two-way ANOVA on glutamate levels across time between rats treated with 0 or 5.0 μm CPG indicated a significant effect of time (F(3,42) = 3.337; p < 0.05). *p < 0.05, difference from respective CPG baseline (0 or 5.0 μm; Fisher's LSD post hoc analysis).
Fig. 4.
Fig. 4.
The cystine–glutamate antiporter is regulated by group II mGluR autoreceptors via a PKA-dependent mechanism. The uptake of [35S]cystine in striatal tissue slices was measured in the presence and absence of the group II agonist APDC, the group II antagonist APICA, the PKA activator Sp-cAMPS, or the PKA inhibitor Rp-cAMPS (n = 4–10/group). Data are presented as [35S]cystine uptake in the presence of inhibitors expressed as percentage of change of [35S]cystine uptake in the absence of inhibitors. A one-way ANOVA on [35S]cystine uptake indicated a significant effect of drug concentration for APDC alone (F(3,27) = 5.34; p< 0.05), APDC plus APICA (F(3,9) = 5.23; p < 0.05), and Rp-cAMPS (F(1,3) = 10.47; p< 0.05). *p < 0.05, difference from [35S]cystine uptake in the absence of inhibitors (Fisher's LSD post hoc analysis).
Fig. 5.
Fig. 5.
Na+-dependent glutamate transporters shape the effect of glutamate released from the cystine–glutamate antiporter. In vivo microdialysis was used to sample extrasynaptic glutamate in the striatum before and after infusion of the broad spectrum Na+-dependent glutamate transport inhibitor TBOA alone (n = 6) or with the cystine–glutamate exchange inhibitor CPG (n = 6). A one-way ANOVA on glutamate levels indicated a significant effect of drug concentration for only TBOA alone (F(3,30) = 9.45;p < 0.05). *p < 0.05, difference from baseline (Fisher's LSD post hocanalysis).
Fig. 6.
Fig. 6.
Glutamate released from the cystine–glutamate antiporter tonically stimulates group II mGluRs regulating glutamate and dopamine release. a, Extrasynaptic glutamate sampledin vivo from the striatum using microdialysis before and after infusion of the group II mGluR antagonist APICA alone (n = 11) or with CPG (n = 6).b, Extrasynaptic glutamate (n = 6) and dopamine (n = 5) sampled from the striatum before and after infusion of CPG alone for 3 hr. c,Extrasynaptic dopamine sampled from the striatum before and after infusion of CPG with the group II mGluR agonist APDC (n = 4). Data are presented as mean (± SEM) glutamate (percentage of baseline) from samples collected during baseline (100 min) or at each drug concentration (60 min/concentration). A one-way ANOVA indicated a significant effect of APICA alone (F(1,10) = 5.21;p < 0.05) or APICA plus CPG (F(2,10) = 6.652; p< 0.05) on glutamate levels (a), CPG alone on glutamate (F(3,18) = 4.00;p < 0.05) or dopamine levels (F(3,12) = 4.82; p< 0.05) (b), and CPG plus APDC (F(3,9) = 9.21; p< 0.05) (c). *p < 0.05, difference from baseline (Fisher's LSD post hocanalysis). +p < 0.05, difference from CPG alone (Fisher's LSD).

Similar articles

Cited by

References

    1. Alagarsamy S, Sorensen SD, Conn PJ. Coordinate regulation of metabotropic glutamate receptors. Curr Opin Neurobiol. 2001;11:357–362. - PubMed
    1. Anwyl R. Metabotropic glutamate receptors: electrophysiological properties and role in plasticity. Brain Res Rev. 1999;29:83–120. - PubMed
    1. Araque A, Li N, Doyle RT, Haydon PG. SNARE protein-dependent glutamate release from astrocytes. Neuroscience. 2000;20:666–673. - PMC - PubMed
    1. Bannai S. Exchange of cystine and glutamate across plasma membrane of human fibroblasts. J Biol Chem. 1986;261:2256–2263. - PubMed
    1. Bannai S, Ishii T. Transport of cystine and cysteine and cell growth in cultured human diploid fibroblasts: effect of glutamate and homocysteate. J Cell Physiol. 1982;112:265–272. - PubMed

Publication types

MeSH terms

Substances

LinkOut - more resources