. 2002 Nov;76(22):11491-504.
doi: 10.1128/jvi.76.22.11491-11504.2002.

Kaposi's sarcoma-associated herpesvirus mitochondrial K7 protein targets a cellular calcium-modulating cyclophilin ligand to modulate intracellular calcium concentration and inhibit apoptosis

Affiliations

Kaposi's sarcoma-associated herpesvirus mitochondrial K7 protein targets a cellular calcium-modulating cyclophilin ligand to modulate intracellular calcium concentration and inhibit apoptosis

Pinghui Feng et al. J Virol. 2002 Nov.

Abstract

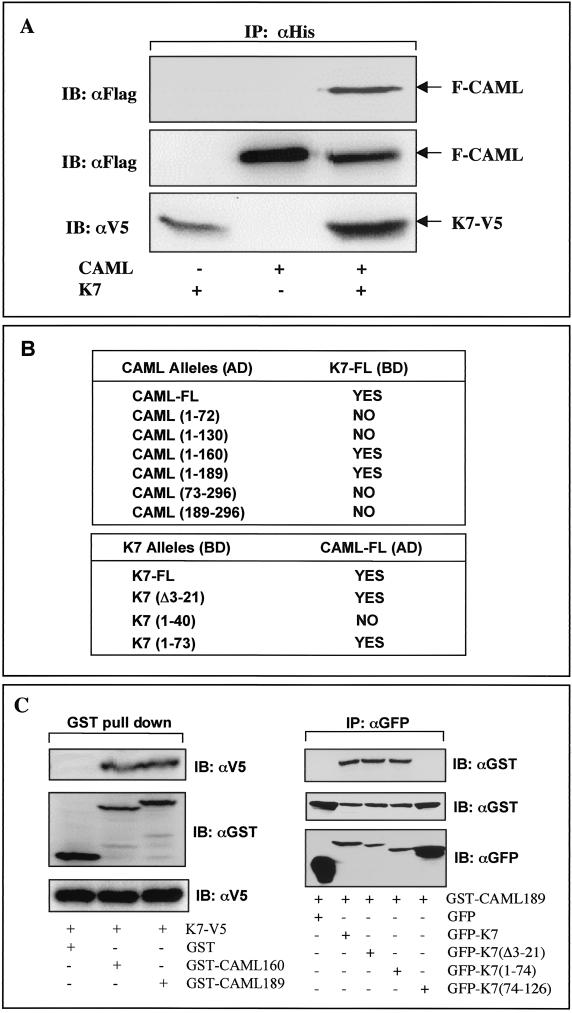
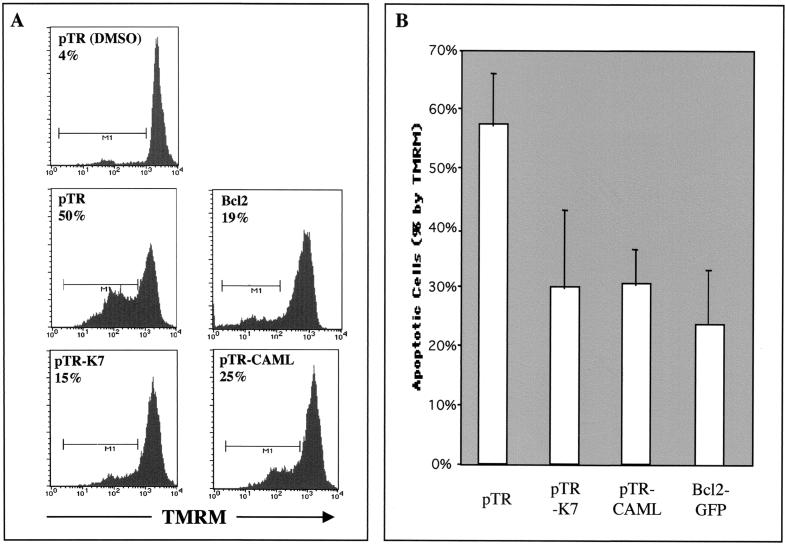
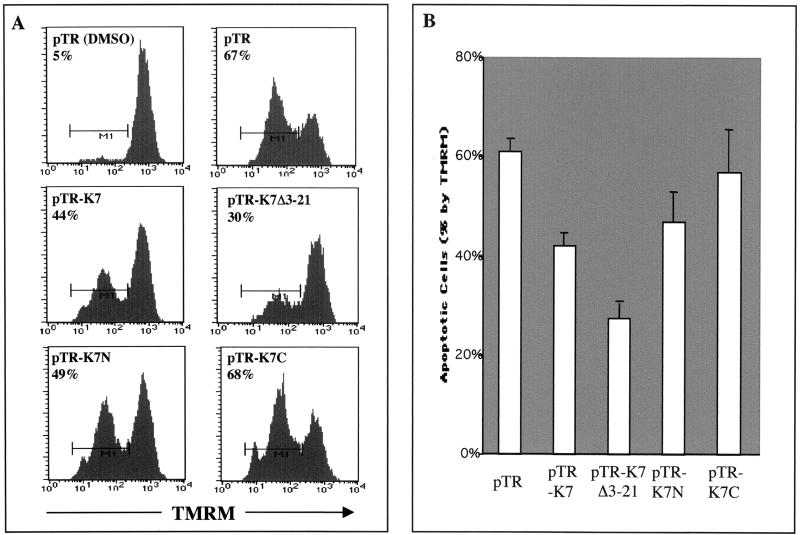
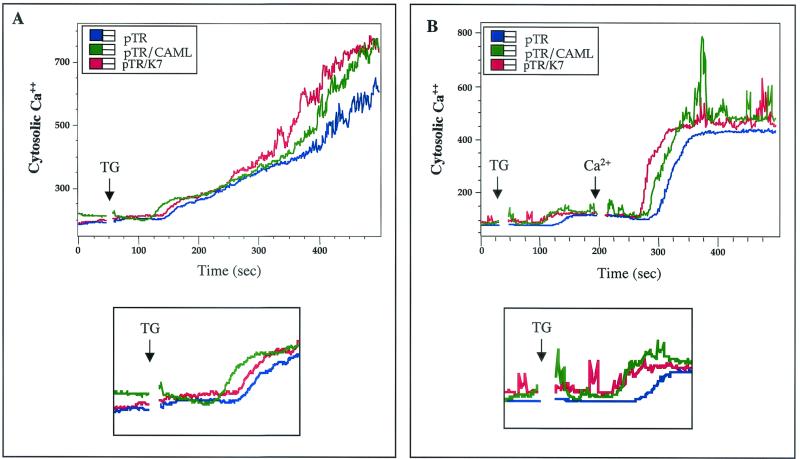
On viral infection, infected cells can become the target of host immune responses or can go through a programmed cell death process, called apoptosis, as a defense mechanism to limit the ability of the virus to replicate. To prevent this, viruses have evolved elaborate mechanisms to subvert the apoptotic process. Here, we report the identification of a novel antiapoptotic K7 protein of Kaposi's sarcoma-associated herpesvirus (KSHV) which expresses during lytic replication. The KSHV K7 gene encodes a small mitochondrial membrane protein, and its expression efficiently inhibits apoptosis induced by a variety of apoptogenic agents. The yeast two-hybrid screen has demonstrated that K7 targets cellular calcium-modulating cyclophilin ligand (CAML), a protein that regulates the intracellular Ca(2+) concentration. Similar to CAML, K7 expression significantly enhances the kinetics and amplitudes of the increase in intracellular Ca(2+) concentration on apoptotic stimulus. Mutational analysis showed that K7 interaction with CAML is required for its function in the inhibition of apoptosis. This indicates that K7 targets cellular CAML to increase the cytosolic Ca(2+) response, which consequently protects cells from mitochondrial damage and apoptosis. This is a novel viral antiapoptosis strategy where the KSHV mitochondrial K7 protein targets a cellular Ca(2+)-modulating protein to confer resistance to apoptosis, which allows completion of the viral lytic replication and, eventually, maintenance of persistent infection in infected host.


Figures

FIG. 1.
FIG. 1.
Identification of K7 and its localization. (A) Identification and glycosylation of K7. At 48 h after transfection with pEF or pEF-K7, 293T cells were lysed by lysis buffer. Whole-cell lysates (WCL) were used for the immunoblot (IB) assay with anti-V5 antibody. Lanes (from left to right): WCL of 293T cells transfected with pEF; WCL of 293T cells transfected with pEF-K7-V5; WCL of 293T cells transfected with pEF-K7-V5 with N-glycosidase F treatment for 12 h; WCL of 293T cells transfected with pEF-K7 N108Q. Arrows indicate the 16- and 21-kDa K7 proteins. (B) Mitochondrial localization of K7 protein. After staining with Mitotracker (red), 293T cells expressing K7 protein were fixed, permeabilized, and reacted with anti-V5 antibody and Alexa 488-conjugated anti-mouse secondary antibody (green). Immunofluorescence was examined using a Leica confocal immunofluorescence microscope, and a single representative optical section is presented. The yellow areas in the merged panel indicate colocalization of the red and green labels. (C) Subcellular fractionation of K7. 293T cells expressing K7 were used for subcellular fractionation as described in Materials and Methods. Whole-cell lysates (WCL), cytosolic fraction (Cyt), and mitochondrial fraction (Mt) were used for an immunoblot assay with anti-V5 and anti-COX-4 antibodies.
FIG.2.
FIG.2.
The N-terminal hydrophobic sequence of K7 is sufficient for mitochondrial localization. COS-1 epithelial cells (A) and ECV endothelial cells (B) were transfected with GFP-K7 expression vector. After Mitotracker staining (red), transfected cells were fixed with paraformaldehyde. Immunofluorescence was examined using a Leica confocal immunofluorescence microscope, and a single representative optical section of each GFP-K7 mutant is presented.
FIG.2.
FIG.2.
The N-terminal hydrophobic sequence of K7 is sufficient for mitochondrial localization. COS-1 epithelial cells (A) and ECV endothelial cells (B) were transfected with GFP-K7 expression vector. After Mitotracker staining (red), transfected cells were fixed with paraformaldehyde. Immunofluorescence was examined using a Leica confocal immunofluorescence microscope, and a single representative optical section of each GFP-K7 mutant is presented.
FIG. 3.
FIG. 3.
Inhibition of apoptosis by K7. At 48 h after electroporation with pTracer-GFP (pTR) or pTracer-GFP/K7 (pTR-K7), BJAB cells were exposed to various apoptogenic agents. The treatment with different apoptogenic reagents is as follows: anti-Fas and TRAIL, 16 h; staurosporin (ST), 2 h; C2 ceramide, A23187, and TG, 4 h. After incubation with these agents, the cells were stained with the mitochondrial membrane-specific dye TMRM for 15 min to assess the mitochondrial membrane potential (ΨTM). After being washed with PBS twice, the cells were analyzed for TMRM intensity by gating of GFP-positive cells. The y axis indicates the reduction of the percentage of TMRM-positive cells after stimulation, indicated as apoptotic cells (%). Data represent an average of triplicate measurements, and error bars indicate standard deviations.
FIG. 4.
FIG. 4.
Interaction between K7 and CAML. (A) Interaction between K7 and CAML in 293T cells. 293T cells were cotransfected with an expression vector containing V5/His-tagged K7 and/or Flag-tagged CAML. (Top) At 48 h posttransfection, whole-cell lysates were used for immunoprecipitation (IP) with an anti-His antibody, followed by immunoblotting (IB) with an anti-Flag antibody. (Middle and bottom) Whole-cell lysates were also used for immunoblotting with anti-Flag and anti-V5 antibodies to examine the expression of K7 and CAML. Transfection with K7 and CAML expression vector is indicated at the bottom of figure. Arrows indicate V5/His-tagged K7 and Flag-tagged CAML protein. (B) Mapping of regions required for the K7-CAML interaction in the yeast two-hybrid screening. Full-length CAML and its deletion mutants were fused to the Gal4 activation domain (AD) vector, and full-length K7 and its deletion mutants were fused to the Gal4 DNA binding domain (BD) vector. The BD vector containing full-length K7 together with AD vector carrying CAML or its mutants were cotransformed into the AH109 yeast strain. Conversely, the AD vector containing full-length CAML together with the BD vector carrying K7 or its mutants were cotransformed into the AH109 yeast strain. After transformation, AH109 yeast cells were examined for growth on selective Leu-, Trp-, His-, and Ade-deficient plates and for color development on X-α-Gal-containing plate. “Yes” indicates positive results from both assays, and “No” indicates negative results from both assays. None of the transformants showed single positivity in either assay. (C). Mapping of interacting regions of K7 and CAML in 293T cells. (Left) 293T cells were transfected with the GST-CAML mammalian expression vector together with K7 expression vector as indicated at the bottom. At 48 h posttransfection, whole-cell lysates were subjected to precipitation with glutathione-Sepharose beads followed by immunoblotting with an anti-V5 antibody (top). Whole-cell lysates were used for immunoblotting to show the equivalent level of expression of K7 and GST-CAML (middle and bottom). (Right) 293T cells were transfected with the GST-CAML mammalian expression vector together with the GFP-K7 expression vector as indicated at the bottom. At 48 h posttransfection, whole-cell lysates were subjected to immunoprecipitation with an anti-GFP antibody, followed by immunoblotting with an anti-GST antibody (top). Whole-cell lysates were used for immunoblotting to show the equivalent level of expression of GFP-K7 and GFP-K7 mutants (middle and bottom).
FIG. 5.
FIG. 5.
Inhibition of apoptosis by K7 and CAML expression. At 24 h after electroporation with pTracer-GFP (pTR), pTracer-GFP/K7 (pTR-K7), pTracer-GFP/CAML (pTR-CAML), or pcDNA-GFP-Bcl-2 (Bcl-2), BJAB cells were treated with dimethyl sulfoxide (DMSO) (top) only or 25 μM TG (other panels) for 4 h. After TG treatment, these cells were stained with the mitochondrial membrane-specific dye TMRM for 15 min to assess the mitochondrial membrane potential (ΨTM). After being washed with PBS twice, the cells were analyzed for TMRM intensity by gating of GFP-positive cells. (A) Histogram of TMRM staining. Representative results of one of three separate experiments are shown. The x axis represents TMRM intensity. Control BJAB cells without TG treatment displayed intense staining with the dye, indicating normal mitochondrial function. The M1 gate indicates the cell population showing a reduction of TMRM fluorescent signal and is presented as the percentage of total GFP-positive cells. (B) Average percent difference in TMRM-positive cells following TG treatment. The reduction of the percentage of TMRM-positive cells after stimulation, indicated as apoptotic cells (%), is represented. Data represent an average of triplicate measurements, and error bars indicate standard deviation.
FIG. 6.
FIG. 6.
K7-CAML interaction is necessary for efficient inhibition of apoptosis. BJAB cells were electroporated with pTracer-GFP (pTR), pTracer-GFP/K7 (pTR-K7), pTracer-GFP/K7 Δ3-21 (pTR-K7 Δ3-21), pTracer-GFP-K7 1-74 (pTR-K7N), or pTracer-GFP-K7 74-126 (pTR-K7C). At 48 h postelectroporation, BJAB cells were treated with dimethyl sulfoxide (DMSO) only or 25 μM TG for 4 h and stained with the mitochondrial membrane-specific dye TMRM for 15 min. These cells were analyzed for TMRM intensity by gating of GFP-positive cells. (A) Histogram of TMRM staining. Representative results of one of three separate experiments are shown. The x axis represents TMRM intensity. The M1 gate indicates the cell population showing a reduction of TMRM fluorescent signal and is presented as the percentage of total GFP-positive cells. (B) Average percent difference in TMRM-positive cells following TG treatment. The reduction of the percentage of TMRM-positive cells after stimulation, indicated as apoptotic cells (%), is represented. Data represent an average of triplicate measurements, and error bars indicate standard deviation.
FIG. 7.
FIG. 7.
K7 and CAML expression alters the kinetics and amplitudes of intracellular Ca2+ concentration on apoptotic stimulation. (A) Increase in cytosolic calcium concentration in the presence of extracellular calcium. BJAB cells electroporated with pTracer-GFP (pTR), pTracer-GFP/K7 (pTR/K7), or pTracer-GFP/CAML (pTR/CAML) were gated for GFP-positive population and treated with 12.5 nM TG. (B) Increase in cytosolic calcium concentration in the absence of extracellular calcium and after addition of extracellular calcium. BJAB cells were extensively washed with Ca2+-free medium before TG treatment. After 200 ms of 12.5 nM TG treatment, 1 mM Ca2+ was added to the cells. The intracellular calcium concentration was monitored over time by noting changes in the ratio of violet to blue (405 to 485 nm) fluorescence of cells loaded with the calcium-sensitive dye indo-1 and analyzed by flow cytometry. Data are presented as a histogram of the number of cells with a particular fluorescence ratio (y axis) against time (x axis). Arrowheads indicate the addition of TG or Ca2+. The breaks in the graphs indicate the time intervals during the addition of TG or Ca2+. The bottom panel of each figure shows a higher magnification of the transient elevation of intracellular Ca2+ concentration immediately after TG treatment. Data were similar in three independent experiments.

Similar articles

Cited by

References

    1. Alexander, L., L. Denekamp, A. Knapp, M. R. Auerbach, B. Damania, and R. C. Desrosiers. 2000. The primary sequence of rhesus monkey rhadinovirus isolate 26-95: sequence similarities to Kaposi's sarcoma-associated herpesvirus and rhesus monkey rhadinovirus isolate 17577. J. Virol. 74:3388-3398. - PMC - PubMed
    1. Arnaudeau, S., W. L. Kelley, J. V. Walsh, Jr., and N. Demaurex. 2001. Mitochondria recycle Ca2+ to the endoplasmic reticulum and prevent the depletion of neighboring endoplasmic reticulum regions. J. Biol. Chem. 276:29430-29439. - PubMed
    1. Ashkenazi, A., and V. M. Dixit. 1998. Death receptors: signaling and modulation. Science 281:1305-1308. - PubMed
    1. Bellows, D. S., B. N. Chau, P. Lee, Y. Lazebnik, W. H. Burns, and J. M. Hardwick. 2000. Antiapoptotic herpesvirus Bcl-2 homologs escape caspase-mediated conversion to proapoptotic proteins. J. Virol. 74:5024-5031. - PMC - PubMed
    1. Bellows, D. S., M. Howell, C. Pearson, S. A. Hazlewood, and J. M. Hardwick. 2002. Epstein-Barr virus BALF1 is a BCL-2-like antagonist of the herpesvirus antiapoptotic BCL-2 proteins. J. Virol. 76:2469-2479. - PMC - PubMed

Publication types

MeSH terms