. 2002 Oct;13(10):3452-65.
doi: 10.1091/mbc.e02-05-0272.

Transcription profiling of Candida albicans cells undergoing the yeast-to-hyphal transition

Affiliations

Transcription profiling of Candida albicans cells undergoing the yeast-to-hyphal transition

André Nantel et al. Mol Biol Cell. 2002 Oct.

Abstract

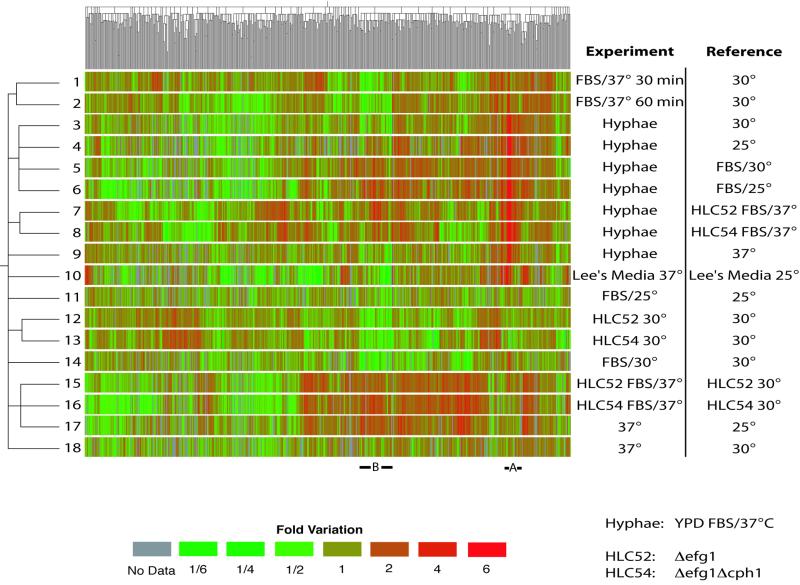
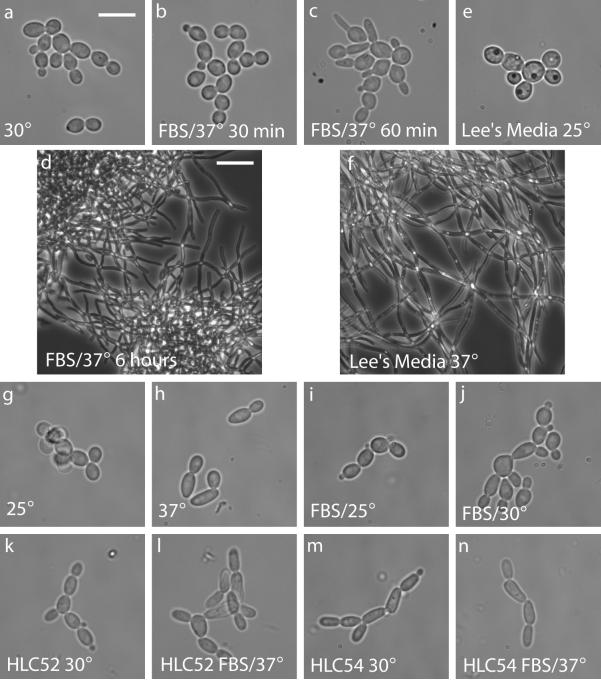
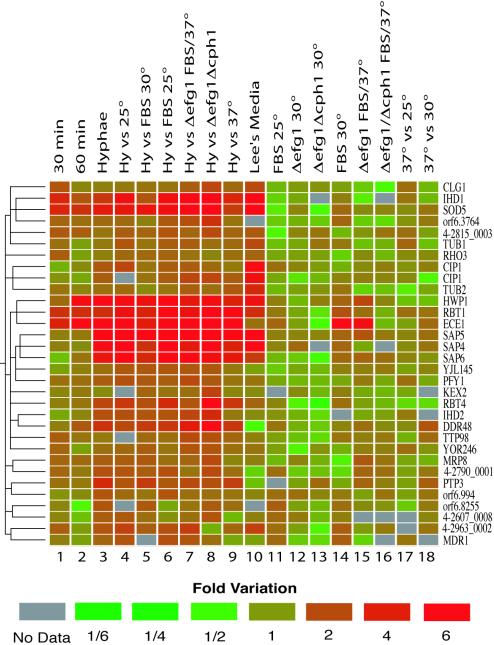
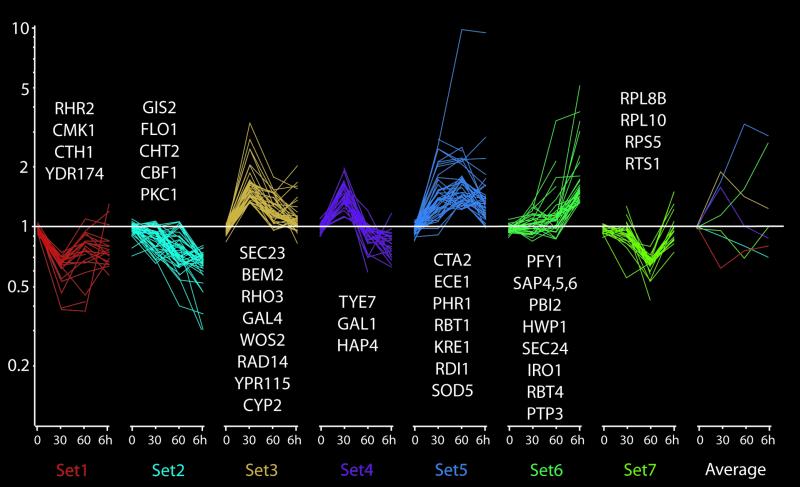
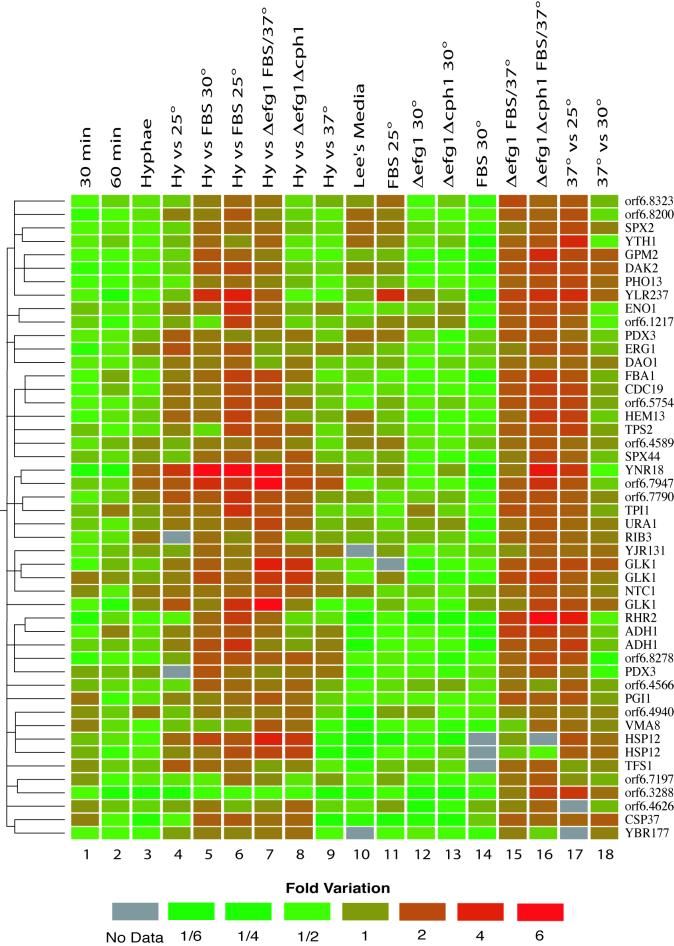
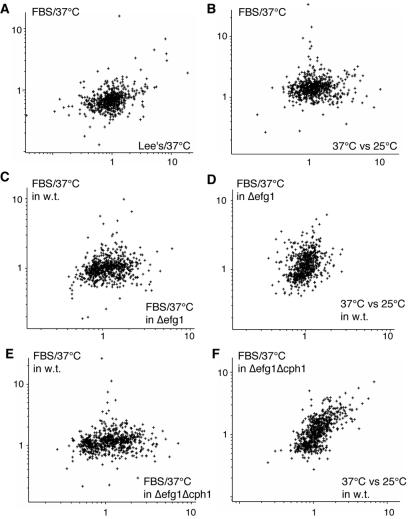
The ability of the pathogenic fungus Candida albicans to switch from a yeast to a hyphal morphology in response to external signals is implicated in its pathogenicity. We used glass DNA microarrays to investigate the transcription profiles of 6333 predicted ORFs in cells undergoing this transition and their responses to changes in temperature and culture medium. We have identified several genes whose transcriptional profiles are similar to those of known virulence factors that are modulated by the switch to hyphal growth caused by addition of serum and a 37 degrees C growth temperature. Time course analysis of this transition identified transcripts that are induced before germ tube initiation and shut off later in the developmental process. A strain deleted for the Efg1p and Cph1p transcription factors is defective in hyphae formation, and its response to serum and increased temperature is almost identical to the response of a wild-type strain grown at 37 degrees C in the absence of serum. Thus Efg1p and Cph1p are needed for the activation of the transcriptional program that is induced by the presence of serum.


Figures

Figure 1
Figure 1
Two-dimensional clustering of gene expression data. The analysis was performed on 742 genes that showed a statistically significant variation in at least one of 18 experiments (see Table 1). Ratios of gene expression obtained by dividing the experimental by the reference samples are represented as a green-to-red color scale. Similarity between gene expression patterns is represented by the horizontal dendrogram. The vertical dendrogram represents the similarity between experiments. Bars and labels (A and B) represent subclusters examined in more detail in Figures 3 and 5.
Figure 2
Figure 2
Morphology of Candida albicans. Yeast phenotype observed in YPD at 30°C (a). Hyphal development after growth at 37°C in YPD + 10% FBS for 30 min (b), 60 min (c), or 6 h (d). In Lee's medium, cells have a yeast-like morphology at 25°C (e) but develop into hyphae by 24 h after an increase in temperature to 37°C (f). Growth in YPD at 25°C (g) is indistinguishable from growth at 30°C, but an increase to 37°C induces cell elongation (h). Addition of 10% FBS in YPD has fewer effects at reduced temperatures of 25°C (i) or 30°C (j). Appearance of the hyphae-defective strains HLC52 (k and l) and HLC54 (m and n) grown in YPD at 30°C (k and m) or under hyphal-inducing conditions at 37°C in YPD + 10% FBS (l and n). The white bars represent a length of either 20 μm (d and f) or 8 μm (a–c, e, and g–n).
Figure 3
Figure 3
Close-up representation of subcluster A (see Figure 1). This section of the two-dimensional clustering is especially enriched in genes that show a significant increase in expression in the hyphal phase (lane 3). Each of these genes is colored according to its change in expression. Downregulated genes are green, whereas upregulated genes are red. See Table 1 or Figure 1 for a detailed description of the experiments in the x-axis.
Figure 4
Figure 4
Changes in gene expression during a time course of the yeast-to-hyphae transition induced by FBS/37°C. The 232 genes that show a statistically significant modulation under the studied conditions were separated by K-means clustering according to their expression pattern at t = 30 min, 60 min, or 6 h. Each line represents one gene, and its change in expression, as defined by the y-axis, in the control arrays and the three times points. Lines are colored according to their K-means set. The rightmost graph shows the average change in gene expression for each of the seven K-means sets as defined by its color. Name of representative members of each sets are shown above or under each graph. For a complete list see the supplemental material.
Figure 5
Figure 5
Close-up representation of subcluster B (see Figure 1). This section of the two-dimensional clustering is especially enriched in genes that are inversely modulated by the addition of serum or an increase in growth temperature. Each of these genes is colored according to its change in expression. Downregulated genes are green, whereas upregulated genes are red. See Table 1 for a detailed description of the experiments in the x-axis.
Figure 6
Figure 6
Comparison of the expression ratios of 742 significantly modulated genes. (A) Scatter plot of changes during the yeast-to-hyphae transition induced by treatment with FBS/37°C compared with a shift to 37°C in Lee's medium. (B) Scatter plot of changes during the yeast-to-hyphae transition induced by treatment with FBS/37°C compared with a 25–37°C temperature shift in YPD. (C) Scatter plot of the gene expression pattern during the response of wild-type or Δefg1 cells to a treatment to FBS/37°C. (D) Comparison of the changes in gene expression during the response of an efg1 mutant to FBS/37°C compared with the changes induced by a 25°C to 37°C shift in wild-type cells. (E) Scatter plot of the gene expression pattern during the response of wild-type or efg1Δcph1 cells to a treatment to FBS/37°C. (F) Comparison of the changes in gene expression during the response of an Δefg1Δcph1 mutant to FBS/37°C compared with the changes induced by a 25°C to 37°C shift in wild-type cells.

Similar articles

Cited by

References

    1. Ashman RB. Candida albicans: pathogenesis, immunity and host defense. Res Immunol. 1998;149:281–288. ; discussion 494–496. - PubMed
    1. Bailey DA, Feldmann PJ, Bovey M, Gow NA, Brown AJ. The Candida albicans HYR1 gene, which is activated in response to hyphal development, belongs to a gene family encoding yeast cell wall proteins. J Bacteriol. 1996;178:5353–5360. - PMC - PubMed
    1. Balciunas D, Ronne H. Yeast genes GIS1–4: multicopy suppressors of the Gal- phenotype of snf1 mig1 srb8/10/11 cells. Mol Gen Genet. 1999;262:589–599. - PubMed
    1. Bidard F, Bony M, Blondin B, Dequin S, Barre P. The Saccharomyces cerevisiae FLO1 flocculation gene encodes for a cell surface protein. Yeast. 1995;11:809–822. - PubMed
    1. Birse CE, Irwin MY, Fonzi WA, Sypherd PS. Cloning and characterization of ECE1, a gene expressed in association with cell elongation of the dimorphic pathogen Candida albicans. Infect Immun. 1993;61:3648–3655. - PMC - PubMed

Publication types

LinkOut - more resources