. 2002 Oct 29;99(22):14031-6.
doi: 10.1073/pnas.222164199. Epub 2002 Oct 18.

Quantitative noise analysis for gene expression microarray experiments

Affiliations

Quantitative noise analysis for gene expression microarray experiments

Y Tu et al. Proc Natl Acad Sci U S A. .

Abstract

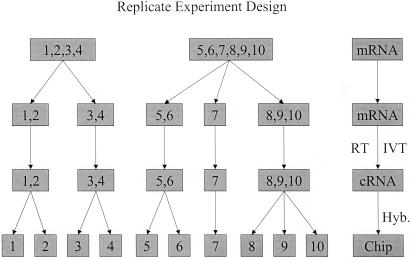
A major challenge in DNA microarray analysis is to effectively dissociate actual gene expression values from experimental noise. We report here a detailed noise analysis for oligonuleotide-based microarray experiments involving reverse transcription, generation of labeled cRNA (target) through in vitro transcription, and hybridization of the target to the probe immobilized on the substrate. By designing sets of replicate experiments that bifurcate at different steps of the assay, we are able to separate the noise caused by sample preparation and the hybridization processes. We quantitatively characterize the strength of these different sources of noise and their respective dependence on the gene expression level. We find that the sample preparation noise is small, implying that the amplification process during the sample preparation is relatively accurate. The hybridization noise is found to have very strong dependence on the expression level, with different characteristics for the low and high expression values. The hybridization noise characteristics at the high expression regime are mostly Poisson-like, whereas its characteristics for the small expression levels are more complex, probably due to cross-hybridization. A method to evaluate the significance of gene expression fold changes based on noise characteristics is proposed.


Figures

Fig 1.
Fig 1.
Illustration of the replicate experiments setup. Two different mRNA samples are used, each being probed multiple times (replicates) with varying degrees of differences in measurement steps to separate the preparation error that occurred during the reverse transcription (RT) and IVT processes and the final hybridization (Hyb.) error.
Fig 2.
Fig 2.
The scatter plots of gene expression value pairs (formula image,formula image) for all genes j ∈ [1,J] and for: (a) experiments pair (1 and 3), where the deviation from the diagonal axis is caused purely by experimental error; (b) experiment pair (1 and 10), where true differences exist between the two transcriptomes.
Fig 3.
Fig 3.
The noise distribution functions at different values of mean expression values: θ0 = 2,3,4,5,6,7,8,9 (a) before and (b) after rescaling by the SD σ20), which is shown in c. Only the positive region of δθ > 0 is shown in a and b for symmetry reasons. The rescaled distribution functions collapse onto a single curve well fitted by Φ(θ′) = 1/2exp(−x2/0.5 + 0.6|x|), plotted as the thick line shown in b.
Fig 4.
Fig 4.
The dependence of the noise strength σformula image, on the expected values of the gene expression for replicates in groups G1 and G2. (Inset) The variance of the sample preparation noise σformula image = σformula image − σformula image is shown. σprep has very weak dependence on the expression value for the large expression levels θ0 ≥ 4.0 and can be fitted by 1.9 × 10⁻³ + 0.12 × e−θ0 for θ0 ≥ 2.
Fig 5.
Fig 5.
Logarithm of the hybridization noise versus the expression level for our data obtained by different versions of Affymetrix MAS. •, Results from MAS 5.0; ▪, results from MAS 4.0. We have also calculated the noise strength from Lemon et al.'s replicate data (see ref. 6), which was performed with a different type of GeneChip array (HuGeneFL), with a different type of sample (human fibroblast cells) and by using MAS 3.1. The agreement between the three results indicates a certain universality of the noise characteristics in the region 3.0 ≤ θ0 ≤ 7.0, where the variance of the noise decays exponentially (see text).
Fig 6.
Fig 6.
(a) The overall hybridization noise (black line) is decomposed into two parts: the hybridization noise for genes that are labeled by MAS 5.0 as present (σhyb,PP, solid line) or absent (σhyb,AA, dotted line). (Inset) σformula image is fitted by 3.2 × 10⁻³ + 0.75 × exp(−0.93θ0). For reference, the fractions of the PP, PA, and AA pairs in all of the replicate experiments at a given mean expression value θ0 are plotted in b.
Fig 7.
Fig 7.
The contour line of p value equal to 0.05. Any pair of expression values (θ12) outside the shaded area represents differently expressed genes beyond experimental noise with a p value of 0.05 or smaller. The two dotted lines represent 2-fold expression changes.

References

    1. Lockhart D. J. & Winzeler, E. A. (2000) Nature 405, 827-836. - PubMed
    1. Brown P. O. & Botstein, D. (1999) Nat. Genet. 21,Suppl., 33-37. - PubMed
    1. Novak J. P., Sladek, R. & Hudson, T. J. (2002) Genomics 79, 104-113. - PubMed
    1. Lee M.-L. T., Kuo, F. C., Whitemore, G. A. & Sklar, I. (2000) Proc. Natl. Acad. Sci. USA 97, 9834-9839. - PMC - PubMed
    1. Lockhart D. J., Dong, H., Byrne, M. C., Follettie, M. T., Gallo, M. V., Chee, M. S., Mittmann, M., Wang, C., Kobayashi, M., Hortan, H. & Brown, E. L. (1996) Nat. Biotechnol. 14, 1675-1680. - PubMed

Publication types

LinkOut - more resources