. 2002 Oct 29;99(22):14059-64.
doi: 10.1073/pnas.212498199. Epub 2002 Oct 18.

Three-dimensional model of the human platelet integrin alpha IIbbeta 3 based on electron cryomicroscopy and x-ray crystallography

Affiliations

Three-dimensional model of the human platelet integrin alpha IIbbeta 3 based on electron cryomicroscopy and x-ray crystallography

Brian D Adair et al. Proc Natl Acad Sci U S A. .

Abstract

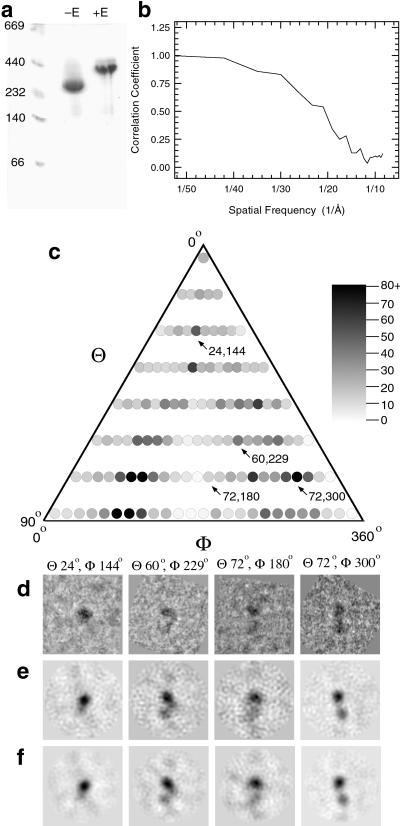
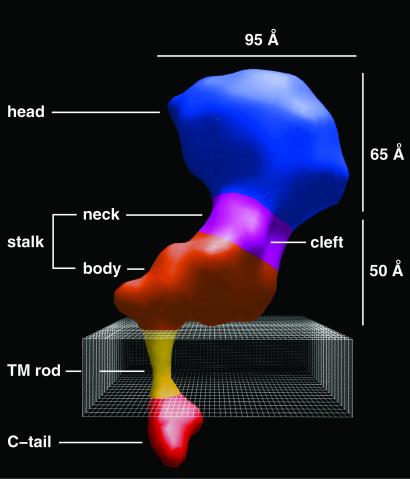
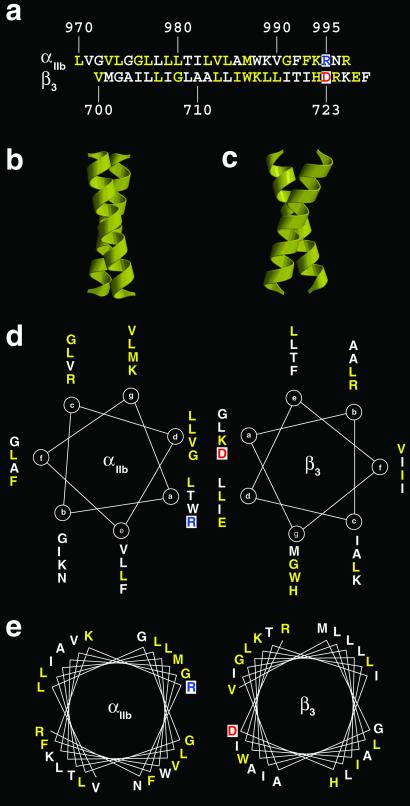
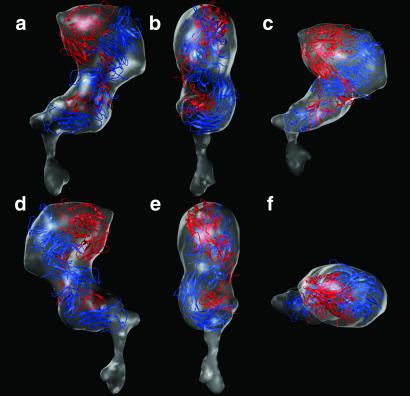
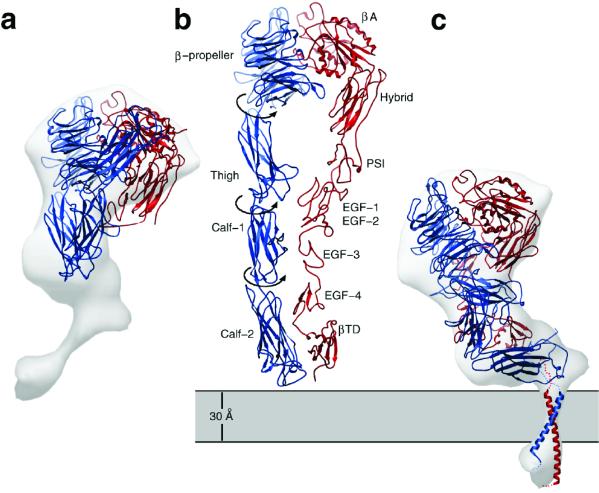
Integrins are a large family of heterodimeric transmembrane signaling proteins that affect diverse biological processes such as development, angiogenesis, wound healing, neoplastic transformation, and thrombosis. We report here the three-dimensional structure at 20-A resolution of the unliganded, low-affinity state of the human platelet integrin alpha(IIb)beta(3) derived by electron cryomicroscopy and single particle image reconstruction. The large ectodomain and small cytoplasmic domains are connected by a rod of density that we interpret as two parallel transmembrane alpha-helices. The docking of the x-ray structure of the alpha(V)beta(3) ectodomain into the electron cryomicroscopy map of alpha(IIb)beta(3) requires hinge movements at linker regions between domains in the crystal structure. Comparison of the putative high- and low-affinity conformations reveals dramatic conformational changes associated with integrin activation.


Figures

Fig 1.
Fig 1.
(a) Native gel electrophoresis of human platelet αIIbβ3 in the presence of 5% octyl-β-d-glucopyranoside. In the absence of the RGD ligand-mimetic echistatin (−E), the purified complex migrated with an apparent molecular mass of 284 kDa, which shifts to 390 kDa in the presence of echistatin (+E). The locations of molecular mass standards are indicated at the left. (b) Fourier shell correlation to determine map resolution. The total data set was divided into two equal groups. The particles in each data set were independently aligned with projections of the final model, and two independent maps were correlated in Fourier space. The curve crosses the 50% threshold at ≈20-Å resolution. (c) Histogram of the raw images in each view of the final model. Images were aligned translationally (x and y) and rotationally in plane (ω), and each particle was assigned to the group to which it best correlated (23). Each circle represents a projection of the final model for a given θ and ϕ value. The number of particles in each group is represented by a linear gray scale with a value of 1 (black) representing 80 or more in the group and a value of 0 (white), no particles in the group. The distribution of orientations is not random (χ2: P ≪ 0.001), because two clusters separated by ≈180° are over-represented. (d) Four representative images and their refined θ and φ Euler angles. Two of the image averages are from relatively well populated groups representing a top-down view (24, 144°) and a side view (72, 300°). This side view was probably easy to identify visually because of the double density provided by the head and stalk domains. A third image (60, 229°) is intermediate in population, whereas view (72, 180°) is the least well populated for these four particles. In general, the under-represented views corresponded to projections in which both the stalk and head domains presented maximal cross-sectional area (and hence minimal density) and were thus more difficult to recognize visually. (e) Class averages for the particle orientations shown in d. (f) Back projections of the final 3D reconstruction according to the same Euler angles. There is progressive increase in the clarity of the images from d to f.
Fig 2.
Fig 2.
Surface-shaded 3D density map of the αIIbβ3 heterodimer at 20-Å resolution. The dimensions and domains are indicated. We presume that the cleft in the neck domain separates the αIIb and β3 subunits, and the larger lobe of the cytoplasmic domain corresponds to the C tail of the β3 subunit, which is twice the size of the αIIb C tail. The model has been oriented so that the putative transmembrane rod is roughly perpendicular to the membrane (boxed area, 30 Å thick).
Fig 3.
Fig 3.
Models for the packing of integrin transmembrane domains. (a) Predicted transmembrane domains for the human integrin αIIb and β3 subunits based on hydropathy analysis. For the αIIb amino acid sequence, the residues colored yellow are identical to residues in the human αV sequence. For the β3 sequence, the yellow residues are identical with the human β1, β5, and β6 sequences. The residues in the putative ion pair R995 (αIIb) and D723 (β3) are colored blue and red, respectively. Ribbon diagrams for 20-residue α-helices, packing as left- (b) and right-handed (c) coiled-coils. Helical wheel representations (d and e) for the human αIIb and β3 integrin transmembrane sequences. The amino acid positions in the heptad are indicated on the wheel. Absolutely conserved residues are colored yellow. The putative ion pair between R995 (αIIb) and D723 (β3) orients the α-helices with respect to each other. (d) Left-handed coiled-coil (3.5 residues per turn). (e) Right-handed coiled-coil (3.9 residues per turn). The sequence projection is taken from the structure of the transmembrane dimer of glycophorin A (47). Note that there are substantially more conserved residues at the αIIbβ3 interface when the α-helices are packed in a right-handed fashion.
Fig 4.
Fig 4.
Docking of the x-ray structure of the αVβ3 ectodomain into the map of αIIbβ3 derived by electron cryomicroscopy and image analysis. (a) Same view as in Fig. 2. With a as a reference and viewed from above, b is rotated clockwise by 90°. (c) Same view as a except tilted 45° toward the viewer. (d) Same as a but rotated 180°. (e) Same as b but rotated 180°. (f) Same as a but rotated 90° toward the viewer. Note the excellent fit of the domains within the x-ray structure to the EM map. In b and e, there is additional density outside of the fitted x-ray model, which may be due to disordered polypeptide not seen in the x-ray map. Because the αIIb and β3 each have six carbohydrate-binding sites (33), we presume that part of this density may also be due to bound carbohydrate that is not included in the x-ray structure. On the basis of a comparison of the migration of the protein on SDS gels (Fig. 1a) with the molecular mass calculated from the sequence, we estimate 20% glycosylation.
Fig 5.
Fig 5.
Ribbon models depicting (a) the x-ray crystal structure of the αVβ3 ectodomain, (b) an extended model of the putative high-affinity state (21), and (c) the model for αIIbβ3 in the low-affinity state based on Fig. 4. The α and β polypeptide chains are colored blue and red, respectively. The 12 domains in the extracellular portion of αVβ3 are labeled in b according to Xiong et al. (21). Superposition of the map derived by electron cryomicroscopy shows a much better fit to the ribbon model shown in c versus the x-ray structure (a). The low-affinity state (c) can be generated from the putative high-affinity state (b) by rearrangements between Ig-like domains that would be analogous to bending at elbow angles in Fab molecules. This hinging at three pivot points would shorten the structure by ≈80 Å and would move the head into proximity with the membrane surface. The map of αIIbβ3 (Fig. 2) shows that the transmembrane domains are associated as a single rod of density, which have been modeled as a right-handed, parallel, α-helical coiled-coil (c). We interpret the larger lobe of the cytoplasmic domain in Fig. 2 as the β3 cytoplasmic tail, which is about twice the size of the α subunit cytoplasmic tail. On the basis of NMR spectroscopy (39), the first 11 residues in the β3 cytoplasmic tail adopt an α-helical conformation, and if they are a continuation of the transmembrane helix as depicted in c, then this region of β3 may function as a lever arm to elicit cytoplasmic conformational changes.

References

    1. Humphries M. J. (2000) Biochem. Soc. Trans. 28, 311-339. - PubMed
    1. Howe A., Aplin, A. E., Alahari, S. K. & Juliano, R. L. (1998) Curr. Opin. Cell Biol. 10, 220-231. - PubMed
    1. Brooks P. C., Clark, R. A. F. & Cheresh, D. A. (1994) Science 264, 569-571. - PubMed
    1. DeSimone D. W. (1994) Curr. Opin. Cell Biol. 6, 747-751. - PubMed
    1. Price D. T. & Loscalzo, J. (1999) Am. J. Med. 107, 85-97. - PubMed

Publication types

MeSH terms

Substances