

Elevated levels of thymus and activation-regulated chemokine (TARC) in pleural effusion samples from patients infested with Paragonimus westermani
- PMID: 12390321
- PMCID: PMC1906524
- DOI: 10.1046/j.1365-2249.2002.01985.x
Elevated levels of thymus and activation-regulated chemokine (TARC) in pleural effusion samples from patients infested with Paragonimus westermani
Abstract
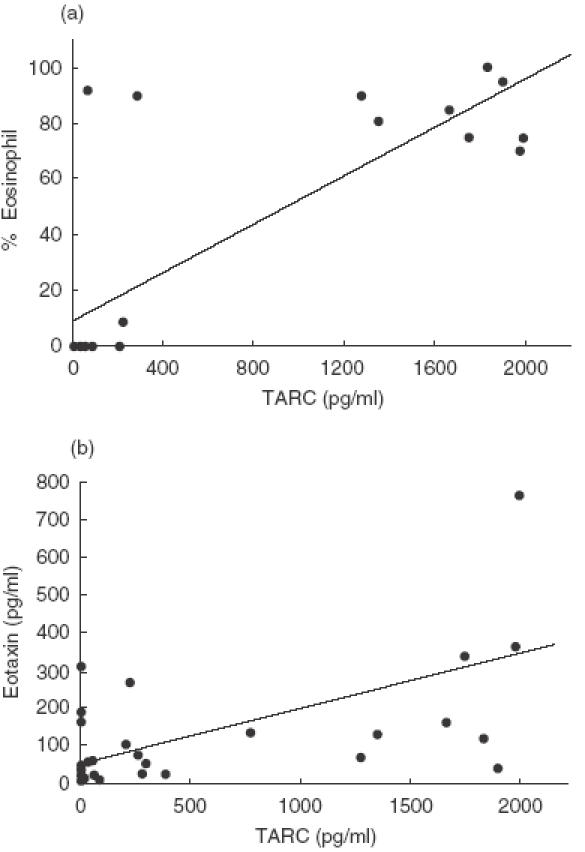
To investigate the pathogenic mechanisms of eosinophilic pleural effusion in patients with paragonimiasis, we measured the levels of various chemokines including thymus and activation-regulated chemokine (TARC), eotaxin, RANTES and IL-8 in pleural effusion samples. Samples were obtained from 11 patients with Paragonimus westermani infection, six patients with pleural transudate, eight with tuberculous pleurisy and five with empyema. High percentages of eosinophils were detected in pleural fluid (range 9-100%, median 81%) of patients with paragonimiasis. TARC concentrations in pleural effusions of paragonimiasis were markedly higher than those of other groups. Eotaxin levels were also higher in pleural effusions of paragonimiasis patients, although significant difference was noted only against transudate samples. There was a significant correlation between TARC concentrations and percentages of eosinophils, and between TARC and eotaxin concentrations in pleural effusion. There were also significant correlations between TARC concentration and the titre of anti-P. westermani IgG and between eotaxin concentration and the titre of anti-P. westermani IgG. Our findings suggest that TARC contributes to the pathogenesis of eosinophilic pleural effusion in paragonimiasis.
Figures


References
-
- Nawa Y. Recent trends of Paragonimiasis westermani in Miyazaki Prefecture. Japan Southeast Asian J Trop Med Public Health. 1991;22:342–4. - PubMed
-
- Mukae H, Taniguchi H, Matsumoto N, et al. Clinicoradiologic features of pleuropulmonary Paragonimus westermani on Kyusyu Island. Japan Chest. 2001;120:514–20. - PubMed
-
- Uchiyama F, Morimoto Y, Nawa Y. Re-emergence of paragonimiasis in Kyushu. Japan Southeast Asian J Trop Med Public Health. 1999;30:686–91. - PubMed
-
- Yokogawa M. Paragonimus and paragonimiasis. Adv Parasitol. 1965;3:99–158. - PubMed
-
- Miyazaki I, Hirose H. Immature lung flukes first found in the muscle of the wild boar in Japan. J Parasitol. 1976;62:836–7. - PubMed
MeSH terms
Substances
LinkOut - more resources
Full Text Sources
Medical
Molecular Biology Databases
