. 2002 Oct 21;196(8):1047-55.
doi: 10.1084/jem.20020911.

Inactivation of the osteopontin gene enhances vascular calcification of matrix Gla protein-deficient mice: evidence for osteopontin as an inducible inhibitor of vascular calcification in vivo

Affiliations

Inactivation of the osteopontin gene enhances vascular calcification of matrix Gla protein-deficient mice: evidence for osteopontin as an inducible inhibitor of vascular calcification in vivo

Mei Y Speer et al. J Exp Med. .

Abstract

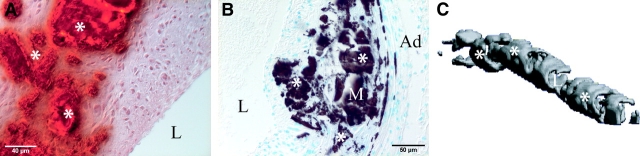
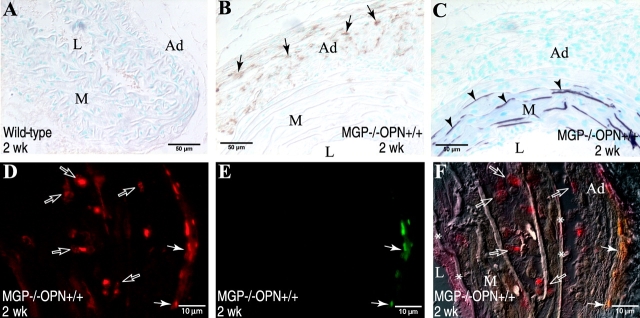
Osteopontin (OPN) is abundantly expressed in human calcified arteries. To examine the role of OPN in vascular calcification, OPN mutant mice were crossed with matrix Gla protein (MGP) mutant mice. Mice deficient in MGP alone (MGP(-/-) OPN(+/+)) showed calcification of their arteries as early as 2 weeks (wk) after birth (0.33 +/- 0.01 mmol/g dry weight), and the expression of OPN in the calcified arteries was greatly up-regulated compared with MGP wild-types. OPN accumulated adjacent to the mineral and colocalized to surrounding cells in the calcified media. Cells synthesizing OPN lacked smooth muscle (SM) lineage markers, SM alpha-actin and SM22alpha. However, most of them were not macrophages. Importantly, mice deficient in both MGP and OPN had twice as much arterial calcification as MGP(-/-) OPN(+/+) at 2 wk, and over 3 times as much at 4 wk, suggesting an inhibitory effect of OPN in vascular calcification. Moreover, these mice died significantly earlier (4.4 +/- 0.2 wk) than MGP(-/-) OPN(+/+) counterparts (6.6 +/- 1.0 wk). The cause of death in these animals was found to be vascular rupture followed by hemorrhage, most likely due to enhanced calcification. These studies are the first to demonstrate a role for OPN as an inducible inhibitor of ectopic calcification in vivo.


Figures

Figure 1.
Figure 1.
OPN expression in the calcified aortas of MGP × OPN mutant mice. (A) Aortas of 2-wk-old MGP−/− OPN+/+ and MGP−/− OPN−/− mice, and their wild-type counterparts were examined immunohistochemically for OPN expression. Arrows and arrowheads indicate OPN expressed in the arterial wall. Open arrows indicate mineral deposition in the MGP−/− OPN−/− aortas, as determined by Alizarin red S staining of adjacent section (not depicted). (B and C) Double staining of aorta of a 6-wk-old MGP−/− OPN+/+ mouse by immunohistochemistry for (B) OPN expression and by (C) Alizarin red S for mineral deposition. Note the association of OPN with mineral (arrows) and cells in the mineralized area (arrowheads). L, lumen; M, media; Ad, adventitia; *, mineral. (D) OPN expression in aortas of mice carrying different genotypes was quantified by MetaMorph image analysis as described in Materials and Methods. Data shown are mean ± SEM, n = 4 − 10.
Figure 1.
Figure 1.
OPN expression in the calcified aortas of MGP × OPN mutant mice. (A) Aortas of 2-wk-old MGP−/− OPN+/+ and MGP−/− OPN−/− mice, and their wild-type counterparts were examined immunohistochemically for OPN expression. Arrows and arrowheads indicate OPN expressed in the arterial wall. Open arrows indicate mineral deposition in the MGP−/− OPN−/− aortas, as determined by Alizarin red S staining of adjacent section (not depicted). (B and C) Double staining of aorta of a 6-wk-old MGP−/− OPN+/+ mouse by immunohistochemistry for (B) OPN expression and by (C) Alizarin red S for mineral deposition. Note the association of OPN with mineral (arrows) and cells in the mineralized area (arrowheads). L, lumen; M, media; Ad, adventitia; *, mineral. (D) OPN expression in aortas of mice carrying different genotypes was quantified by MetaMorph image analysis as described in Materials and Methods. Data shown are mean ± SEM, n = 4 − 10.
Figure 2.
Figure 2.
Quantification of calcium amount in vessels of MGP−/− OPN+/+ and MGP−/− OPN−/− mice. 2- and 4-wk-old mice with indicated genotypes were killed by nembutal and their aortas were dissected and lyophilized. Calcium content of the lyophilized vessels was determined using a Sigma-Aldrich calcium diagnostic kit as described in Materials and Methods. Data shown are mean ± SEM, n = 4 − 9, F = 106.5, P < 0.0001 (analysis of variance).
Figure 3.
Figure 3.
Representative histological analyses and microcomputed tomography of calcified arteries. (A–C) Aortic mineralization of 4-wk-old MGP−/− OPN+/− mice was visualized by (A) Alizarin red S, (B) Von Kossa, and (C) microcomputed tomography. The average thickness of the calcified region for three aortas from 4-wk-old MGP−/− OPN+/− mice was 92.2 ± 26.4 microns. (D–I) Histological analyses of calcified arteries: (D and E) Von Kossa staining, (F–H) Hematoxylin and eosin staining, and (I) Alizarin red S staining. Note (G) elastic laminae fragmentation (arrows), (H) vessel rupture (arrowheads), and (I) aneurysm formation (arrowheads). L, lumen; M, media; Ad, adventitia; *, mineral.
Figure 3.
Figure 3.
Representative histological analyses and microcomputed tomography of calcified arteries. (A–C) Aortic mineralization of 4-wk-old MGP−/− OPN+/− mice was visualized by (A) Alizarin red S, (B) Von Kossa, and (C) microcomputed tomography. The average thickness of the calcified region for three aortas from 4-wk-old MGP−/− OPN+/− mice was 92.2 ± 26.4 microns. (D–I) Histological analyses of calcified arteries: (D and E) Von Kossa staining, (F–H) Hematoxylin and eosin staining, and (I) Alizarin red S staining. Note (G) elastic laminae fragmentation (arrows), (H) vessel rupture (arrowheads), and (I) aneurysm formation (arrowheads). L, lumen; M, media; Ad, adventitia; *, mineral.
Figure 4.
Figure 4.
SMCs in calcified arteries lose their lineage marker, SM α-actin. (A–C) Aortas of 2- and 4-wk-old MGP × OPN mutant mice were examined for mineral deposition by Von Kossa staining (arrows) and (D–F) for SM α-actin by immunohistochemistry (arrowheads). Note the loss of SM α-actin in the mineralized area of aortas from (E) 2-wk and (F) 4-wk MGP−/− OPN−/− mice. L, lumen; M, media; Ad, adventitia. (G) Correlation of aortic SM α-actin expression and calcium deposition. SM α-actin expression in the aortas of MGP × OPN mutant mice was quantified by MetaMorph image analysis of the stained sections and the corresponding vascular calcium deposition by determining the acid-released calcium using a Sigma-Aldrich calcium diagnostic kit as described in Materials and Methods. n = 38, P < 0.001.
Figure 4.
Figure 4.
SMCs in calcified arteries lose their lineage marker, SM α-actin. (A–C) Aortas of 2- and 4-wk-old MGP × OPN mutant mice were examined for mineral deposition by Von Kossa staining (arrows) and (D–F) for SM α-actin by immunohistochemistry (arrowheads). Note the loss of SM α-actin in the mineralized area of aortas from (E) 2-wk and (F) 4-wk MGP−/− OPN−/− mice. L, lumen; M, media; Ad, adventitia. (G) Correlation of aortic SM α-actin expression and calcium deposition. SM α-actin expression in the aortas of MGP × OPN mutant mice was quantified by MetaMorph image analysis of the stained sections and the corresponding vascular calcium deposition by determining the acid-released calcium using a Sigma-Aldrich calcium diagnostic kit as described in Materials and Methods. n = 38, P < 0.001.
Figure 5.
Figure 5.
Macrophages are not the predominant cells to synthesize OPN in calcified aortas of MGP × OPN mutant mice. (A and B) Aortas of 2-wk-old MGP × OPN mutant mice were stained immunohistochemically for macrophages using streptavidin-conjugated peroxidase. Note the recruitment of macro-phages into (B) adventitia of calcified arteries (arrows), but not in (A) normal vessels. (C) Adjacent section stained for mineral (arrowheads) by Von Kossa. Colocalization of macrophages and OPN was further determined by double immunohistochemical staining using fluorophore-conjugated secondary antibodies. (D) Rhodamine-OPN, (E) Cyanine-BM8, and (F) Overlay of D and E onto a differential interference contrast photo of the same field. Note OPN+ cells (red in D and red and yellow in F) were present mostly in the medial layer where macrophages (green in E and green and yellow in F) were absent. Arrows, macrophages; open arrows, OPN-expressing cells except macrophages; arrowheads, mineral; L, lumen; M, media; Ad, adventitia; *, internal and external elastic laminae.

Similar articles

Cited by

References

    1. Rumberger, J.A., D.B. Simons, L.A. Fitzpatrick, P.F. Sheedy, and R.S. Schwartz. 1995. Coronary artery calcium area by electron-beam computed tomography and coronary atherosclerotic plaque area. A histopathologic correlative study. Circulation. 92:2157–2162. - PubMed
    1. Lehto, S., L. Niskanen, M. Suhonen, T. Ronnemaa, and M. Laakso. 1996. Medial artery calcification. A neglected harbinger of cardiovascular complications in non-insulin-dependent diabetes mellitus. Arterioscler. Thromb. Vasc. Biol. 16:978–983. - PubMed
    1. Olson, J.C., D. Edmundowicz, D.J. Becker, L.H. Kuller, and T.J. Orchard. 2000. Coronary calcium in adults with type 1 diabetes: a stronger correlate of clinical coronary artery disease in men than in women. Diabetes. 49:1571–1578. - PubMed
    1. Sangiorgi, G., J.A. Rumberger, A. Severson, W.D. Edwards, J. Gregoire, L.A. Fitzpatrick, and R.S. Schwartz. 1998. Arterial calcification and not lumen stenosis is highly correlated with atherosclerotic plaque burden in humans: a histologic study of 723 coronary artery segments using nondecalcifying methodology. J. Am. Coll. Cardiol. 31:126–133. - PubMed
    1. Beadenkopf, W.G., A.S. Daoud, and B.M. Love. 1964. Calcification in the coronary arteries and its relationship to arteriosclerosis and myocardial infarction. Am. J. Roentgenol. 92:865–871. - PubMed

Publication types