. 2002 Oct 21;196(8):1079-90.
doi: 10.1084/jem.20020991.

Constitutive presentation of a natural tissue autoantigen exclusively by dendritic cells in the draining lymph node

Affiliations

Constitutive presentation of a natural tissue autoantigen exclusively by dendritic cells in the draining lymph node

Clemens Scheinecker et al. J Exp Med. .

Abstract

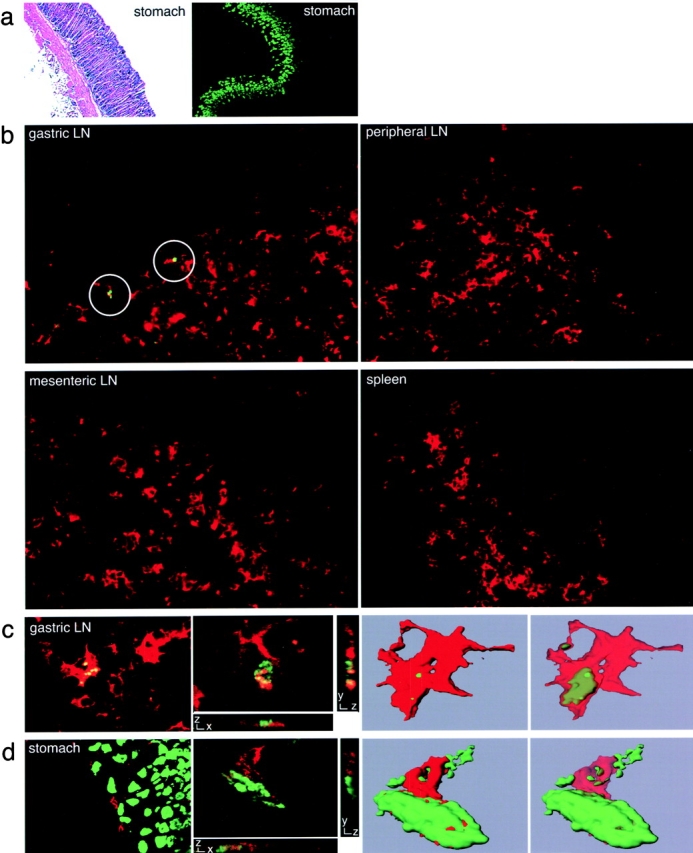
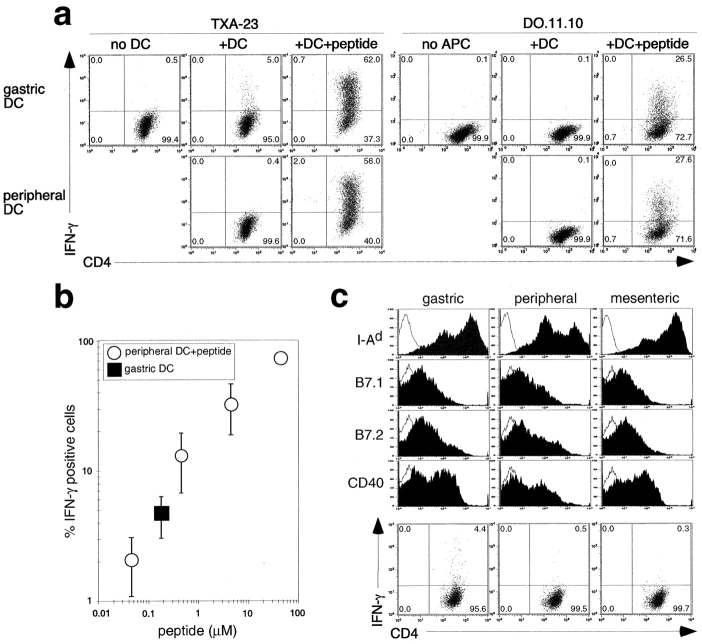
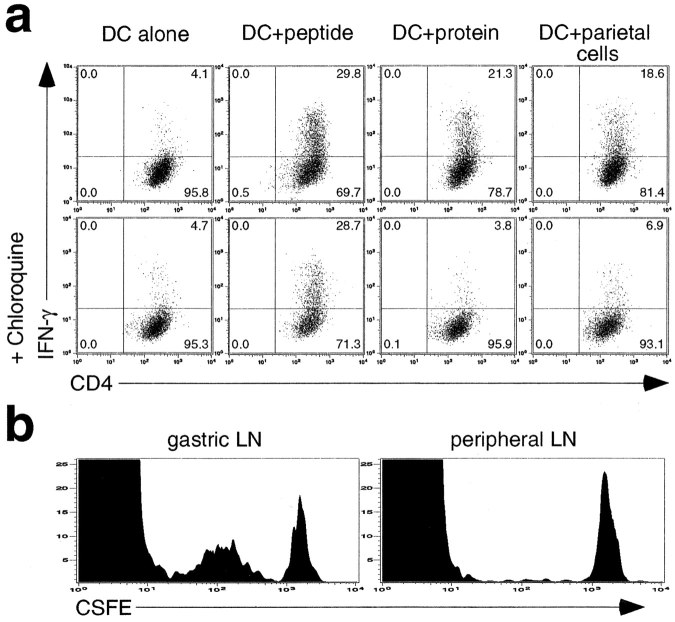
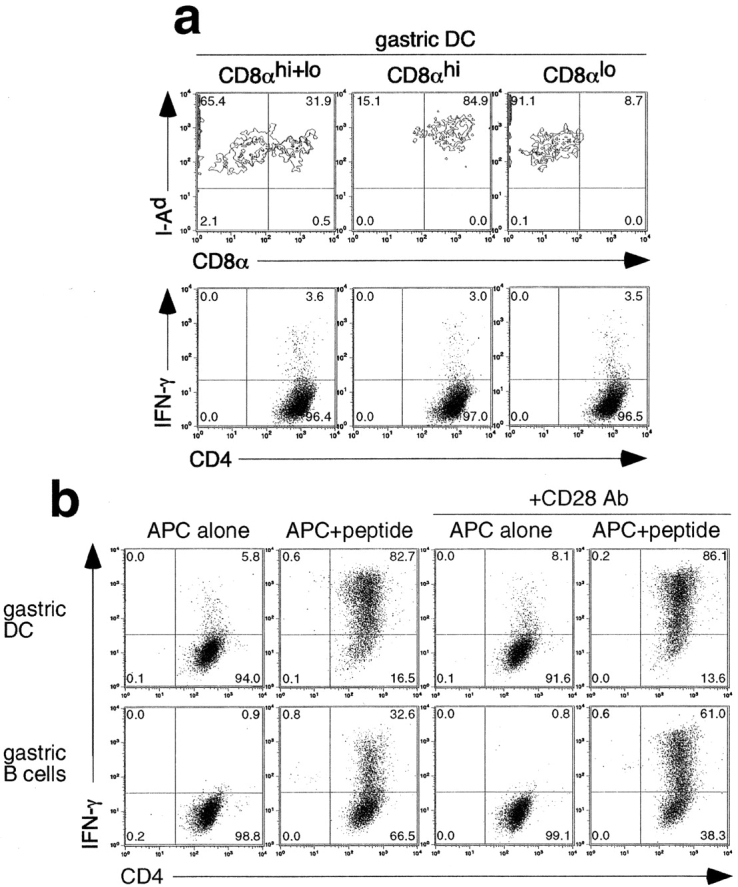
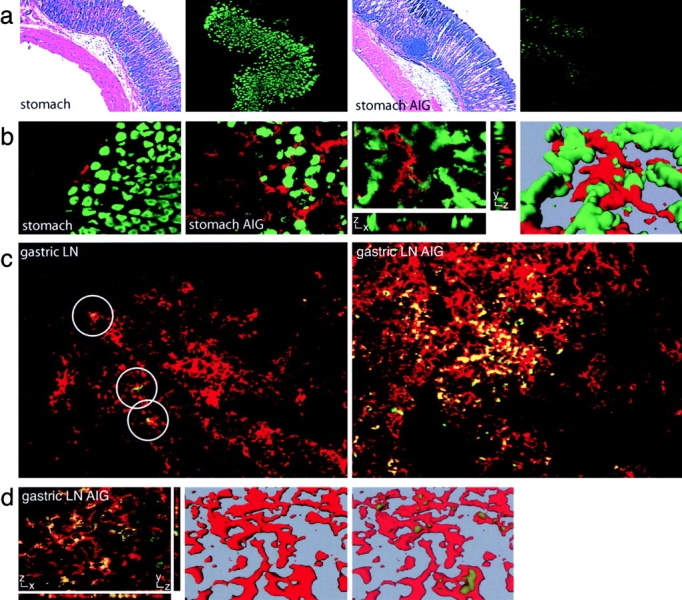
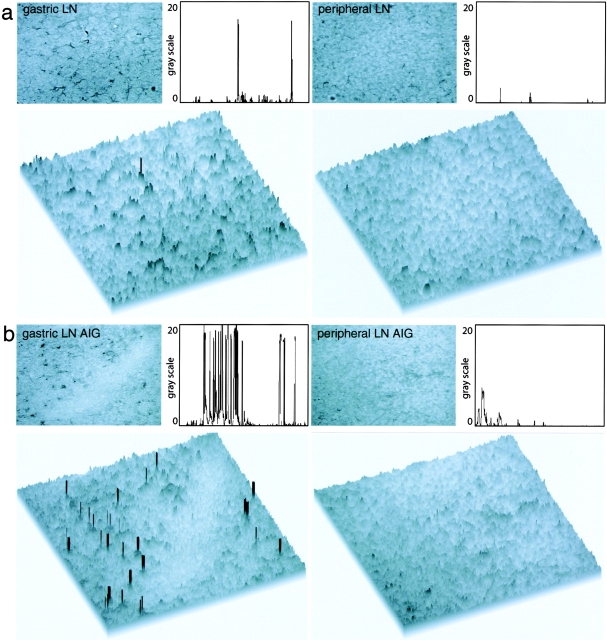
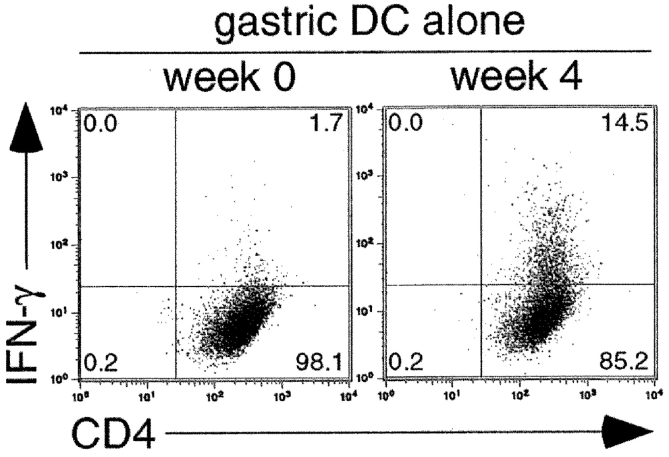
The major histocompatibility complex (MHC)-dependent presentation of processed tissue-specific self-antigens can contribute to either peripheral (extrathymic) tolerance or the differentiation of autoreactive T cells. Here, we have studied the MHC class II molecule presentation of gastric parietal cell (PC)-specific H(+)/K(+)-ATPase, which induces a destructive autoimmune gastritis in BALB/c mice lacking CD4(+) CD25(+) regulatory T cells. Immunofluorescence microscopy showed physical association of CD11c(+) dendritic cells (DCs) with PCs in the gastric mucosa. H(+)/K(+)-ATPase protein was found within vesicular compartments of a few CD11c(+) DCs only in the draining gastric lymph node (LN) and these antigen-containing DCs increased markedly in number with the onset of tissue destruction in autoimmune animals. Both CD8alpha(hi) and CD8alpha(lo) gastric DCs, but not peripheral or mesenteric DCs, showed evidence of constitutive in vivo processing and presentation of H(+)/K(+)-ATPase. These data provide direct support for a widely held model of local tissue antigen uptake and trafficking by DCs in normal animals and demonstrate that DCs in the draining LN can present a tissue-specific self-antigen under noninflammatory conditions without fully deleting autoreactive T cells or inducing active autoimmunity.


Figures

Figure 1.
Figure 1.
Immunofluorescence staining of H+/K+-ATPase and DCs in gastric LN and stomach sections. (a) Sections of gastric tissue from healthy, untreated BALB/c mice were stained with hematoxylin and eosin (left) or with FITC-2G11, specific for the β subunit of gastric H+/K+-ATPase (right). (b) Sections of gastric LN, peripheral LN, mesenteric LN, and spleen from healthy BALB/c mice were stained with FITC-2G11 (green) with anti–CD11c-TXRD (red). Positive staining with the anti–H+/K+-ATPase mAb was detected in sections of gastric LN (circles). (c) Sections of a gastric LN from a healthy BALB/c mouse stained for both H+/K+-ATPase (green) and CD11c (red) (first panel). Laser scanning confocal microscopy was conducted on a similarly stained gastric LN section. One individual optical section in the z-plane is shown with cross-sectional profiles in the y and x axes (second panel). A 3D reconstruction of the whole cell was produced from these image data (third panel) and the intracellular localization of the H+/K+-ATPase staining (green) was visualized by decreasing the opacity of the CD11c staining (red; fourth panel). (d) A stomach section from a healthy BALB/c mouse stained for both H+/K+-ATPase (green) and CD11c (red; first panel). Laser scanning confocal microscopy was conducted on a similarly stained stomach section. One individual optical section in the z-plane is shown with cross-sectional profiles in the y and x axes (second panel). A 3D reconstruction of the whole cell was produced from these image data, which demonstrates the juxtaposition of H+/K+-ATPase+ PCs (green) and a CD11c+ DCs (red; third panel). By decreasing the opacity of the CD11c staining (red), the intracellular localization of H+/K+-ATPase staining (green) was visualized (fourth panel).
Figure 2.
Figure 2.
Gastric but not peripheral DCs induce the activation of TXA-23 T cells. (a) Intracellular IFN-γ staining of TXA-23 and DO11.10 cells T cells. TXA-23 and DO11.10 T cells were cultured for 16–18 h alone (no DC) in the presence of isolated gastric or peripheral DCs (+DC), and in the presence of DCs with added H+/K+-ATPase peptide (final concentration 50μg/ml) or OVA peptide (+DC +peptide; final concentration 10μM). For TXA-23 cells, one representative experiment out of ten, and for DO11.10 one out of four, is shown. Markers were set according to isotype-matched negative control staining in this and all similar experiments. (b) The stimulatory capacity of isolated gastric DCs compared with that of peripheral DCs pulsed with graded amounts of H+/K+-ATPase peptide. (c) Surface phenotype of gastric, peripheral, and mesenteric DCs (filled) in comparison to isotype-matched negative control staining (open). IFN-γ responses of TXA-23 cells that were cultured for 16–18 h in the presence of gastric, peripheral, or mesenteric DCs in the absence of added antigen are also shown (one representative experiment out of three).
Figure 3.
Figure 3.
Gastric DCs constitutively present H+/K+-ATPase antigen. (a) TXA-23 cells were cultured for 16–18 h in the presence of gastric DCs in the absence (DC alone) or presence of H+/K+-ATPase peptide (DC+peptide; 5 μg/ml), H+/K+-ATPase protein (DC+protein; 50 μg/ml), or a preparation of PCs (DC+PCs; DC/PC ratio = 1:2). Cultures were performed either in the absence (top) or presence (bottom) of chloroquine (final concentration 75 μM). Primary data are shown as dot plots of IFN-γ intracellular staining. One representative experiment out of two is shown. (b) Thymocytes expressing the TXA-23 TCR were labeled with CFSE and transferred into BALB/c mice. After 3 d the transferred transgenic T cells in the gastric and peripheral LN were analyzed for evidence of cell division based on dilution of the CFSE label. One representative experiment out of four is shown.
Figure 4.
Figure 4.
Phenotype and H+/K+-ATPase presenting function of different cell populations. (a) Staining of isolated CD11c+ DCs and of isolated CD11c+ CD8αhi and CD11c+ CD8αlo subpopulations for MHC class II molecule (I-Ad) and CD8α expression (top). TXA-23 cells were cultured for 16–18 h in the presence of these CD11c+ CD8αhi, CD11c+ CD8αlo, or unseparated CD11c+ DCs in the absence of added antigen. The dot plots show intracellular IFN-γ production by TXA-23 cells (bottom). One representative experiment out of three is shown. (b) TXA-23 cells were cultured for 16–18 h in the presence of gastric LN DCs (gastric DC) or gastric LN B cells (gastric B cells) either in the absence (APC alone) or presence (APC+peptide) of specific H+/K+-ATPase peptide (50 μg/ml). The dot plots show intracellular IFN-γ production by TXA-23 cells. Anti-CD28 mAb (final concentration 10 μg/ml) was added to cocultures of TXA-23 cells with either gastric LN DCs (gastric DC) or gastric LN B cells (gastric B) in the absence or presence of H+/K+-ATPase peptide (50 μg/ml). One representative experiment out of three is shown.
Figure 5.
Figure 5.
Immunofluorescence staining of H+/K+-ATPase and DCs in the gastric LN and stomach sections of animals with AIG. (a) Stomach sections from untreated BALB/cnu/nu mice (stomach) and BALB/cnu/nu mice with AIG (stomach AIG) were stained with hematoxylin and eosin (first and third panel) or with FITC-2G11 (second and fourth panel). (b) Double staining of stomach sections of untreated BALB/cnu/nu mice (stomach) and BALB/cnu/nu mice with AIG (stomach AIG) for H+/K+-ATPase (green) and anti–CD11c-TXRD (red). Laser scanning confocal microscopy was conducted on a similarly stained stomach section from an animal with AIG. One individual optical section in the z-plane is shown with cross-sectional profiles in the y and x axes (third panel). A 3D reconstruction of the whole cell was produced from these image data, which demonstrates the juxtaposition of H+/K+-ATPase+ PCs (green) and a CD11c+ DC (red; fourth panel). (c) Gastric LN sections of an untreated BALB/cnu/nu mouse (gastric LN) and a BALB/cnu/nu mouse with AIG (gastric LN AIG) were stained with FITC-2G11 (green) and anti–CD11c-TXRD (red). Positive staining with the anti–H+/K+-ATPase mAb is restricted to CD11c+ DCs (circles). (d) Laser scanning confocal microscopy was conducted on a similarly stained gastric LN section from an animal with AIG. One individual optical section in the z-plane is shown with cross-sectional profiles in the y and x axes (left). A 3D reconstruction of the whole cell was produced from these image data (middle) and the intracellular localization of the H+/K+-ATPase staining (green) was visualized by decreasing the opacity of the CD11c staining (red; right).
Figure 6.
Figure 6.
Quantitative immunohistochemical analysis of H+/K+-ATPase in LN sections of untreated animals and animals with AIG. (a) Anti–H+/K+-ATPase FITC-stained LN sections of untreated BALB/c mice were incubated with secondary anti-FITC HRPO Ab and developed using enhanced diaminobenzidine substrate. Pictures were taken with the bright field setting of the microscope (top) and additionally analyzed using the public domain NIH Image program. Single peaks represent positive staining for H+/K+-ATPase in the threshold histogram plot profile (top) and in the surface plot view (bottom) and can be detected in gastric LN, but not peripheral LN, sections of untreated animals. (b) In animals with AIG, an increase in the staining frequency for H+/K+-ATPase was observed in gastric LN (gastric LN AIG), but not in peripheral LN (peripheral LN AIG), sections.
Figure 7.
Figure 7.
Increase of TXA-23 stimulatory capacity of gastric DCs during AIG. The capacity of gastric DCs to induce IFN-γ production of TXA-23 T cells in the absence of added antigen was analyzed in untreated BALB/cnu/nu mice and in BALB/cnu/nu mice 4 wk after the adoptive transfer of CD4+ CD25 T cells to induce AIG. The dot plots show intracellular IFN-γ production by TXA-23 cells upon coculture for 12–16 h with gastric DCs from untreated BALB/cnu/nu mice (week 0) and BALB/cnu/nu with AIG (week 4) in the absence of added antigen. One representative experiment out of three is shown.

Comment in

References

    1. von Boehmer, H. 1988. The developmental biology of T lymphocytes. Annu. Rev. Immunol. 6:309–326. - PubMed
    1. Robey, E., and B.J. Fowlkes. 1994. Selective events in T cell development. Annu. Rev. Immunol. 12:675–705. - PubMed
    1. Schwartz, R.H. 1989. Acquisition of immunologic self-tolerance. Cell. 57:1073–1081. - PubMed
    1. Schonrich, G., F. Momburg, M. Malissen, A.M. Schmitt-Verhulst, B. Malissen, G.J. Hämmerling, and B. Arnold. 1992. Distinct mechanisms of extrathymic T-cell tolerance due to differential expression of self antigen. Int. Immunol. 4:581–590. - PubMed
    1. Hawiger, D., K. Inaba, Y. Dorsett, M. Guo, K. Mahnke, M. Rivera, J.V. Ravetch, R.M. Steinman, and M.C. Nussenzweig. 2001. Dendritic cells induce peripheral T cell unresponsiveness under steady state conditions in vivo. J. Exp. Med. 194:769–779. - PMC - PubMed

Publication types