. 2002 Oct 28;159(2):291-302.
doi: 10.1083/jcb.200203048. Epub 2002 Oct 21.

Ca2+-controlled competitive diacylglycerol binding of protein kinase C isoenzymes in living cells

Affiliations

Ca2+-controlled competitive diacylglycerol binding of protein kinase C isoenzymes in living cells

Johannes C Lenz et al. J Cell Biol. .

Abstract

The cellular decoding of receptor-induced signaling is based in part on the spatiotemporal activation pattern of PKC isoforms. Because classical and novel PKC isoforms contain diacylglycerol (DAG)-binding C1 domains, they may compete for DAG binding. We reasoned that a Ca2+-induced membrane association of classical PKCs may accelerate the DAG binding and thereby prevent translocation of novel PKCs. Simultaneous imaging of fluorescent PKC fusion proteins revealed that during receptor stimulation, PKC alpha accumulated in the plasma membrane with a diffusion-limited kinetic, whereas translocation of PKC epsilon was delayed and attenuated. In BAPTA-loaded cells, however, a selective translocation of PKC epsilon, but not of coexpressed PKC alpha, was evident. A membrane-permeable DAG analogue displayed a higher binding affinity for PKC epsilon than for PKC alpha. Subsequent photolysis of caged Ca2+ immediately recruited PKC alpha to the membrane, and DAG-bound PKC epsilon was displaced. At low expression levels of PKC epsilon, PKC alpha concentration dependently prevented the PKC epsilon translocation with half-maximal effects at equimolar coexpression. Furthermore, translocation of endogenous PKCs in vascular smooth muscle cells corroborated the model that a competition between PKC isoforms for DAG binding occurs at native expression levels. We conclude that Ca2+-controlled competitive DAG binding contributes to the selective recruitment of PKC isoforms after receptor activation.


Figures
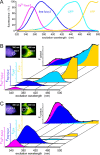
Figure 1.
Figure 1.
Spectral deconvolution of overlapping fluorochromes eliminates cross-bleeding between multiple fluorochromes. (A) Excitation spectra of single fluorochromes were recorded by digital fluorescence microscopy. Spectra of Ca2+-bound fura-2 and free fura-2 were obtained in HEK cells after equilibration with ionomycin (10 μM for 3 h) in the presence (Ca2+–fura-2) and absence (free fura-2) of external Ca2+, respectively. Excitation spectra of CFP and YFP were acquired after transient expression of the respective fluorescent protein in HEK cells. All spectra were normalized to the maximal fluorescence intensities of the respective dye. (B and C) Due to differential distribution of fluorescent molecules in different regions of interest (ROI) corresponding to the peripheral cytosol (B) or the nucleus (C), cross-bleeding of fluorochromes frequently accounts for a major portion of the signals at a given excitation wavelength. The spectrum over the respective area (Fcytosol or Fnucleus) is additively composed of signals arising from single fluorochromes (FCa2+–fura-2, Ffree fura-2, FCFP, and FYFP). The relative contribution of each fluorochrome to the composite spectrum of the probe was calculated by a regression-based spectral evaluation algorithm.
Figure 2.
Figure 2.
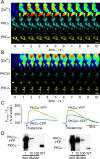
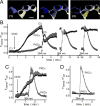
PKCα suppresses a receptor-induced plasma membrane translocation of PKCɛ. (A) Transiently transfected HEK cells were stimulated via a coexpressed H1 histamine receptor (histamine 100 μM), and fluorescences were recorded at multiple excitation wavelengths (340, 360, 380, 410, 430, 450, and 480 nm) at the indicated time points after agonist application. Image data were processed by a pixel-by-pixel regression-based spectral evaluation algorithm to dissect signals arising from CFP and YFP and to calibrate [Ca2+]i. The calibrated [Ca2+]i is encoded by a rainbow pseudocolor scale (0–1,000 nM). Note the poor translocation of PKCɛ and the coincident [Ca2+]i elevation and translocation of PKCα. (B) Simultaneous imaging of the histamine-induced translocation of PKCα–YFP and PKCβ1–CFP. Bars, 20 μm. (C) Time-course of translocation of PKC fusion proteins from the experiments shown in A and B. For explanation of the assay, see Fig. 3 legend. (D) Expression levels of transiently overexpressed PKCα–YFP and PKCɛ–YFP were compared with those of endogenously expressed PKC isoenzymes by immunoblot analysis. Cytosolic fractions were prepared from transiently transfected cells (transfection efficiency >50%) or from wild-type HEK cells (WT). The undiluted samples were adjusted to contain 20 μg of total protein per lane. Blots were probed with either anti-PKCα or anti-PKCɛ antibodies; the molecular weight of the bands correspond to the expected sizes of wild-type PKCs or the respective YFP-fused proteins.
Figure 3.
Figure 3.
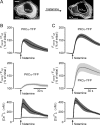
Ca2 + -dependent collisional coupling efficiency of PKCα and PKCɛ. Transiently transfected HEK cells were loaded with fura-2 and imaged by digital videomicroscopy. (A) The fluorometric determination of PKC translocation was based on the measurement of mean fluorescence intensities over ROIs that were defined over the outer border of the cell mostly representing the plasma membrane (ROImemb) and over the cytosol (ROIcyt) of the same cell. Bar, 5 μm. (B and C, top and middle) The receptor-induced plasma membrane translocation of PKCα–YFP (B) or PKCɛ–YFP (C) was monitored in HEK cells with (gray lines) or without (black lines) preincubation with BAPTA-AM (10 μM, 15 min at 37°C). HEK cells were cotransfected with plasmids encoding the indicated PKC fusion proteins and the H1 histamine receptor. The addition of histamine (100 μM) to the bath solution is indicated by arrows. The mean fluorescence intensities (Fmemb and Fcyt) were calculated for the ROImemb and ROIcyt of single cells, expressed as ratios, and normalized to the initial values. (B and C, bottom) [Ca2+]i signals were recorded in parallel to control the efficiency of the Ca2+ clamp by intracellularly loaded BAPTA. Data represent means and SEM of n = 3–4 independent experiments (each experiment comprises averaged data of 6–15 single cells).
Figure 4.
Figure 4.
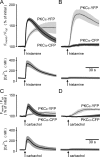
A competitive translocation of PKC isoforms is controlled by [Ca2 + ]i. The Ca2+ dependency of the histamine- or carbachol- induced PKC translocation was analyzed in HEK cells that were transiently transfected with PKCα–CFP, PKCɛ–YFP, and the H1 histamine receptor. Cells were stimulated with either histamine (100 μM; A and B) or carbachol (20 μM; C and D) acting on an endogenously expressed M1 family acetylcholine receptor. The agonist application is indicated by arrows. [Ca2+]i elevations and translocations of the indicated PKC isoenzymes were simultaneously recorded without (A and C) or with pretreatment with 10 μM BAPTA-AM (B and D). The translocation of fluorescent PKC fusion proteins was assessed as described in Fig. 3. Data represent means and SEM of n = 3–5 independent experiments. In each experiment, data of 8–22 single cells were averaged.
Figure 5.
Figure 5.
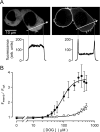
Differential DAG binding affinity of PKCα and PKCɛ in living cells. Fluorescent PKC fusion proteins were transiently transfected in HEK cells and challenged with various concentrations of the membrane-permeable DOG. (A) Confocal images of a PKCɛ–YFP-expressing cell were taken before and 60 s after application of DOG (300 μM), and fluorescence intensity profiles were recorded over the cytoplasm and the adjacent plasma membrane of single cells. (B) The mean cytosolic and plasma membrane fluorescence intensities were recorded for either PKCα (open symbols) or PKCɛ (filled symbols), as shown in A, and expressed as ratios. Data represent means ± SEM of five independent experiments (each experiment comprises averaged data of three to five cells).
Figure 6.
Figure 6.
PKCα and PKCɛ compete for DAG binding in a Ca2 + - dependent manner. (A) HEK cells were transiently cotransfected with PKCα–CFP (shown in blue) and PKCɛ–YFP (yellow channel), loaded with caged Ca2+ (o-nitrophenyl-EGTA, 10 μM), and imaged by confocal time-lapse microscopy. Images before (1) and 3 min after (2) the addition of the membrane-permeable DOG (10 μM) are shown. Subsequently, caged Ca2+ was photolyzed by applying a brief pulse of maximal laser energy at 364 nm (3). Bar, 10 μm. (B) Kinetic analysis of the whole experiment shown in A. Fluorescence intensities over the plasma membrane and the cytosol are expressed as ratios and SD of four cells. Comparable cell groups were allocated on the same coverslip and subjected to photolysis of caged Ca2+ (as indicated by the flash symbols) at later time points. (C) Similar experiment as in B, but with separately transfected PKCɛ–CFP and PKCα–YFP so that each cell expresses either PKCα–YFP or PKCɛ–CFP. (D) Equivalent experiment as in C, but without previous addition of DOG. Representatives of three independent experiments with similar results are shown.
Figure 7.
Figure 7.
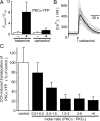
PKCα concentration dependently suppresses the receptor-induced translocation of stably expressed PKCɛ. (A) A HEK cell line that stably expresses low levels of PKCɛ–YFP (HEKPKCɛ–YFP) was generated and transfected with the H1 histamine receptor. Cells were stimulated with either histamine (100 μM) or carbachol (100 μM; acting via an endogenous muscarinic receptor) as indicated. The plasma membrane association of PKCɛ–YFP was assessed before (open bars) and 20 s after agonist application (black bars) by confocal line-scan microscopy as described in Fig. 5. Data of three to six cells per experiment were averaged and expressed as means and SEM of four independent experiments. (B) Carbachol (100 μM)- induced [Ca2+]i signals were determined in fura-2–loaded single HEKPKCɛ–YFP cells (gray lines). The mean [Ca2+]i is superimposed (black line). (C) HEKPKCɛ–YFP cells were again transfected with PKCα–CFP. An endogenous muscarinic receptor was stimulated with carbachol (CCh; 100 μM), and PKC translocation was assessed as described in Fig. 3. The maximal translocation of PKCɛ–YFP in response to the agonist was normalized to cells that did not express additional PKCα–CFP (open bar). Molar ratios of PKCα and PKCɛ expression were calculated from the fluorescence intensities of the differently tagged PKC fusion proteins in single cells, and cells were grouped as indicated. Data represent means and SEM of seven independent transfection and imaging experiments.
Figure 8.
Figure 8.
Extraction of PKCα–YFP in the absence or presence of Ca2 + . HEK cells were stably transfected with YFP-fused PKCα. After treating cells with either buffer (−), ionomycin (iono; 10 μM, 2 min), carbachol (CCh; 100 μM, 15 s) or PMA (10 μM, 5 min). Cells were lysed in either Ca2+-free (nominally Ca2+-free buffer supplemented with 0.5 mM EGTA) or Ca2+-containing (1 mM) extraction buffers as indicated. Soluble and particulate fractions were separated and analyzed by fluorescence spectroscopy to obtain the ratio of fluorescence intensities (Fparticulate/Fsoluble). Data represent means and SEM of four independent extraction experiments.
Figure 9.
Figure 9.
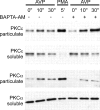
The translocation of PKCα and PKCɛ in vascular smooth muscle cells is controlled in a Ca2 + -dependent manner. Neonatal rat AoSMCs were pretreated with or without BAPTA-AM and subsequently stimulated with AVP (1 μM) for the indicated times. Particulate and soluble fractions were probed for endogenously expressed PKCα and PKCɛ as indicated. PMA stimulation (10 μM, 5 min) was included as a control.

Similar articles

Cited by

References

    1. Almholt, K., P.O. Arkhammar, O. Thastrup, and S. Tullin. 1999. Simultaneous visualization of the translocation of protein kinase Cα-green fluorescent protein hybrids and intracellular calcium concentrations. Biochem. J. 337:211–218. - PMC - PubMed
    1. Baldassare, J.J., P.A. Henderson, D. Burns, C. Loomis, and G.J. Fisher. 1992. Translocation of protein kinase C isozymes in thrombin-stimulated human platelets. J. Biol. Chem. 267:15585–15590. - PubMed
    1. Bokkala, S., and S.K. Joseph. 1997. Angiotensin II-induced down-regulation of inositol trisphosphate receptors in WB rat liver epithelial cells. J. Biol. Chem. 272:12454–12461. - PubMed
    1. Braz, J.C., O.F. Bueno, L.J. De Windt, and J.D. Molkentin. 2002. PKCα regulates the hypertrophic growth of cardiomyocytes through extracellular signal–regulated kinase1/2 (ERK1/2). J. Cell Biol. 156:905–919. - PMC - PubMed
    1. Codazzi, F., M.N. Teruel, and T. Meyer. 2001. Control of astrocyte Ca2+ oscillations and waves by oscillating translocation and activation of protein kinase C. Curr. Biol. 11:1089–1097. - PubMed

Publication types

MeSH terms