. 2002 Nov;22(22):7820-30.
doi: 10.1128/MCB.22.22.7820-7830.2002.

Activation of the mouse histone deacetylase 1 gene by cooperative histone phosphorylation and acetylation

Affiliations

Activation of the mouse histone deacetylase 1 gene by cooperative histone phosphorylation and acetylation

Christoph Hauser et al. Mol Cell Biol. 2002 Nov.

Abstract

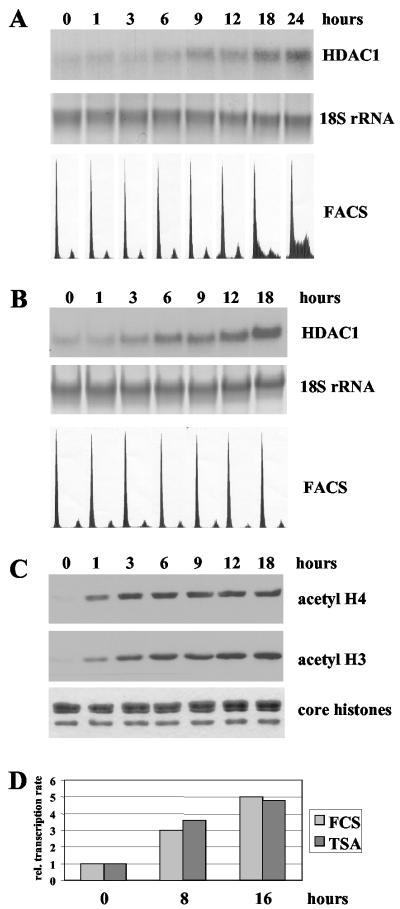
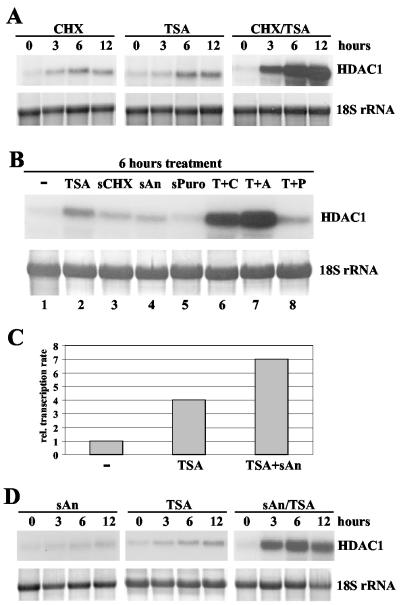
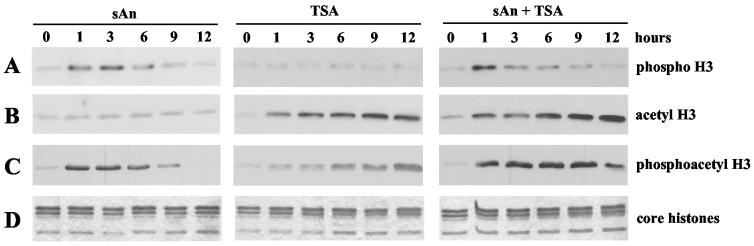
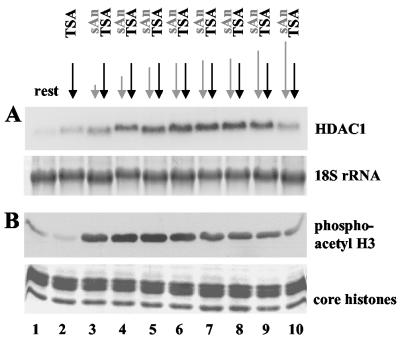
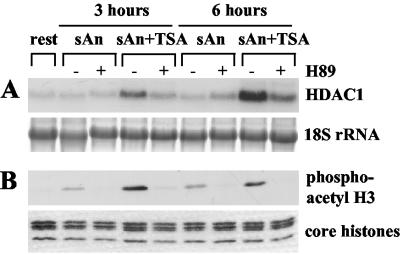
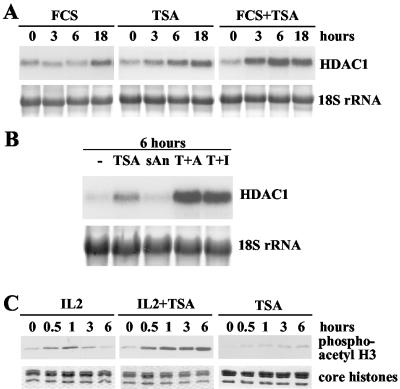
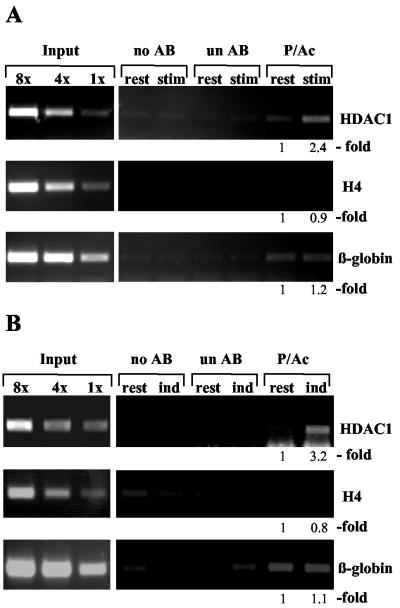
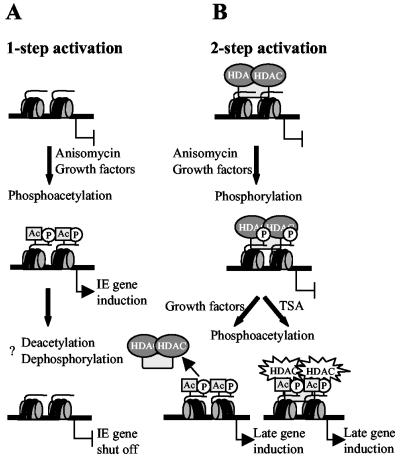
Histone deacetylase 1 (HDAC1) is a major regulator of chromatin structure and gene expression. Tight control of HDAC1 expression is essential for normal cell cycle progression of mammalian cells. HDAC1 mRNA levels are regulated by growth factors and by changes in intracellular deacetylase activity levels. Stimulation of the mitogen-activated protein kinase cascade by anisomycin or growth factors, together with inhibition of deacetylases by trichostatin A (TSA), leads to stable histone H3 phosphoacetylation and strongly induced HDAC1 expression. In contrast, activation of the nucleosomal response by anisomycin alone results only in transient phosphoacetylation of histone H3 without affecting HDAC1 mRNA levels. The transcriptional induction of the HDAC1 gene by anisomycin and TSA is efficiently blocked by H89, an inhibitor of the nucleosomal response. Detailed studies of the kinetics of histone acetylation and phosphorylation show that the two modifications are synergistic and essential for induced HDAC1 transcription. Activation of the HDAC1 gene by anisomycin together with TSA or by growth factors is accompanied by phosphoacetylation of HDAC1 promoter-associated histone H3. Our results present evidence for a precise regulatory mechanism which allows induction of the HDAC1 gene in response to proliferation signals and modulation of HDAC1 expression dependent on intracellular deacetylase levels.


Figures

FIG. 1.
FIG. 1.
Activation of the mouse HDAC1 gene by growth factors or TSA. (A) Total RNA of quiescent Swiss 3T3 cells, stimulated for different periods (indicated in hours) with 20% FCS, was analyzed on a Northern blot by hybridization with a radiolabeled HDAC1 cDNA. To confirm equal loading and transfer of RNA, 18S rRNA was visualized with methylene blue. Cell cycle arrest and serum stimulation was monitored by FACS analysis. (B) Swiss 3T3 cells were arrested by serum deprivation and treated with 50 ng of TSA/ml for the indicated times. Total RNA was extracted and analyzed for the presence of HDAC1 mRNA as described for panel A. The DNA content of resting and TSA-treated cells was monitored by FACS analysis. (C) Histones were isolated from the cells treated as described for panel B, resolved on a denaturing SDS-16% polyacrylamide gel, transferred to a nitrocellulose membrane, and analyzed on a Western blot with antibodies specific for acetylated histone H3 (acetyl H3) and acetylated histone H4 (acetyl H4). In parallel, a duplicate gel was stained with Coomassie blue to confirm equal loading of histones. (D) In vitro run-on transcription assays. Nuclei of serum-deprived Swiss 3T3 cells or resting cells treated for 8 and 16 h with 20% FCS or 50 ng of TSA/mlwere used to determine the transcription rate of the HDAC1 gene. Equal amounts of radiolabeled newly synthesized RNA were hybridized to single-stranded DNA probes. HDAC1-specific transcription signals for each time point were quantified by densitometric scanning on a Molecular Dynamics Storm 840 Scanner and are depicted as relative transcription rates. The value for HDAC1 transcription in resting cells was arbitrarily set to 1.
FIG. 2.
FIG. 2.
Cooperative activation of the HDAC1 gene by inducers of the MAP kinase pathway and TSA. (A) Cycloheximide cooperates with TSA in the induction of HDAC1 mRNA expression. Swiss 3T3 cells were arrested by serum deprivation and treated with 10 μg of cycloheximide (CHX)/ml or 50 ng of TSA/ml or both agents together for the times (in hours) indicated. Total RNA was extracted and analyzed on Northern blots for HDAC1 expression. 18S rRNA was stained with methylene blue. (B) Subinhibitory concentrations of anisomycin are sufficient to synergize with TSA in the activation of the HDAC1 gene. Resting Swiss 3T3 cells were left untreated (−) or treated for 6 h with 50 ng of TSA/ml, 50 ng of cycloheximide (sCHX)/ml, 50 ng of anisomycin (sAn)/ml, 100 ng of puromycin (sPuro)/ml, or TSA in combination with a translation inhibitor (TSA plus cycloheximide [T+C], TSA plus anisomycin [T+A], or TSA plus puromycin [T+P]). Total RNA was prepared and probed with the radiolabeled HDAC1 cDNA. The 18S rRNA was visualized by staining of the membrane with methylene blue. (C) Transcriptional activation of HDAC1 by cooperation between TSA and the MAP kinase pathway inducer anisomycin. The nuclei of Swiss 3T3 cells, after being subjected to serum arrest treatment for 48 h, were treated for 6 h with 50 ng of TSA/ml or TSA plus 50 ng of anisomycin (TSA+sAn)/ml and used to determine the transcription rate of the HDAC1 gene. Values for each time point were obtained by densitometric scanning of HDAC1-specific transcription signals. Severalfold induction values were calculated as the ratio of transcriptional activity in resting cells to that in stimulated cells. (D) Resting Swiss 3T3 cells were stimulated with subinhibitory concentrations of anisomycin (sAn; 50 ng/ml) or TSA (50 ng/ml) or both drugs simultaneously (sAn/TSA) for the indicated periods. Total RNA was prepared and probed as previously described. To confirm equal loading and transfer of RNA, 18S rRNA was stained with methylene blue.
FIG. 3.
FIG. 3.
TSA-mediated acetylation stabilizes serine 10 phosphorylation at histone H3 in anisomycin-stimulated cells. Serum-starved Swiss 3T3 cells were stimulated with 50 ng of anisomycin (sAn)/ml or 50 ng of TSA/ml or with anisomycin and TSA simultaneously (sAn + TSA) for the indicated periods. Acid-soluble nuclear proteins were isolated in the presence of phosphatase and deacetylase inhibitors and analyzed on a Western blot, using phospho-H3 antibodies (A) or acetyl-H3 antibodies (B) or phosphoacetyl-H3 antibodies (C). (D) Duplicate gels were stained with Coomassie blue to ensure equal loading.
FIG. 4.
FIG. 4.
Simultaneous induction of histone H3 acetylation and phosphorylation is required for efficient HDAC1 gene activation. (A) Northern blot analysis of resting Swiss 3T3 cells treated with 50 ng of TSA/ml for 6 h. Anisomycin (50 ng/ml) was added either during the last 1, 3, 5, or 6 h (lanes 3 to 6) after TSA treatment or 15 min, 30 min, 1 h, or 3 h before TSA treatment (lanes 7 to 10). As controls, cells were left untreated (lane 1) or treated only with TSA (lane 2). The Northern blot was hybridized with the radiolabeled HDAC1 cDNA. To confirm equal loading of RNA, the nylon membrane was stained with methylene blue after transfer. (B) In parallel, Western blot analysis of core histones, which were isolated from cells treated as described in panel A, was performed. Levels of dimodified histone H3 were determined with phosphoacetyl-H3 antibodies. To ensure equal loading, duplicate gels were processed and stained with Coomassie blue.
FIG. 5.
FIG. 5.
H89 inhibits the induction of the HDAC1 gene during combinatorial TSA and anisomycin treatment. (A) Northern blot analysis of resting Swiss 3T3 cells left untreated or pretreated with 10 μM H89 for 15 min. Cells were then left untreated (−) or stimulated (+) for the indicated time periods with 50 ng of anisomycin (sAn)/ml alone or with anisomycin in combination with TSA (sAn+TSA). The Northern blot was hybridized with the radiolabeled HDAC1 cDNA (HDAC1). Transferred 18S rRNA was stained with methylene blue to confirm loading and transfer of similar amounts of RNA. (B) Phosphoacetylation of histone H3 is inhibited by H89. Western blot analysis of core histones isolated from cells treated as described for panel A was performed with a phosphoacetyl-H3 antibody. To confirm equal loading, a duplicate gel was stained with Coomassie blue.
FIG. 6.
FIG. 6.
Superinduction of HDAC1 mRNA levels by TSA in combination with growth factors. (A) Resting S 3T3 cells were treated for the indicated time periods with 20% FCS or TSA (50 ng/ml) or TSA and serum simultaneously (FCS+TSA). Total RNA was prepared, and HDAC1 mRNA was detected by Northern blot hybridization with a radiolabeled HDAC1 cDNA probe. The 18S rRNA was visualized by staining of the membranes with methylene blue. (B) IL-2-deprived B6.1 cells were left untreated (−) or stimulated for 6 h with 50 ng of TSA/ml alone or 50 ng of anisomycin (sAn)/ml alone or TSA in combination with anisomycin (T+A) or IL-2 (T+I). Northern blot analysis was done as described for panel A. (C) Histones from cells treated for the indicated periods with IL-2, TSA, or TSA in combination with IL-2 (IL-2+TSA) were isolated in the presence of phosphatase inhibitors and deacetylase inhibitors and analyzed on a Western blot, using phosphoacetyl-H3 antibodies.
FIG. 7.
FIG. 7.
Increased phosphoacetylation of promoter-associated histone H3 during activation of the HDAC1 gene. (A) Formaldehyde cross-linked chromatin was prepared from arrested (rest) and TSA-plus-anisomycin (50 ng/ml each) (stim)-treated Swiss 3T3 cells and was precipitated without antibody (no AB), with an unspecific antibody (un AB), or with a phosphoacetylated H3 antibody (P/Ac). DNA from the antibody-bound fraction and total input DNA isolated from chromatin used for the immunoprecipitation were analyzed by quantitative PCR. PCR products were quantified using the ImageQuant program, and relative signal intensities are indicated. (B) Formaldehyde cross-linked chromatin from IL-2-deprived cells (rest) and from B6.1 cells subjected to induction with IL-2 for 16 h (ind) was left untreated (no AB) or was immunoprecipitated with a phosphoacetyl-H3 antibody (P/Ac) or an unspecific antibody (un AB). PCR analysis was performed as described for panel A. The results shown are representative of three independent experiments.
FIG. 8.
FIG. 8.
Model for the activation of immediate-early genes and the HDAC1 gene by histone H3 phosphoacetylation. (A) One-step model for immediate-early genes. The default state of these genes favors acetylation. Activation of the MAP kinase pathway by either growth factors or pharmacological agents like anisomycin leads to the rapid and transient phosphoacetylation of histone H3 and simultaneous activation of immediate-early gene transcription. The mechanisms to turn off gene expression are not yet elucidated but might involve deacetylation and dephosphorylation of histone H3. (B) Two-step model for the HDAC1 gene. Due to the presence of deacetylases, the default state of this gene favors deacetylation. Induction of the nucleosomal response can induce histone H3 phosphorylation but not phosphoacetylation at the promoter. In a second step, the local balance between deacetylases and acetylases is changed either by inhibition of HDACs by TSA or by dissociation of deacetylases in response to growth signals. Both mechanisms result in phosphoacetylation of histone H3 at the HDAC1 gene locus. HATs might already be present but dominated by HDACs or specifically recruited. Active HATs prevent dephosphorylation of serine 10, thereby stabilizing the phosphoacetylation mark on histone H3. This mechanism would ensure transcription for as long as the cells proliferate.

Similar articles

Cited by

References

    1. Barratt, M. J., C. A. Hazzalin, E. Cano, and L. C. Mahadevan. 1994. Mitogen-stimulated phosphorylation of histone H3 is targeted to a small hyperacetylation-sensitive fraction. Proc. Natl. Acad. Sci. USA 91:4781-4785. - PMC - PubMed
    1. Bartl, S., J. Taplick, G. Lagger, H. Khier, K. Kuchler, and C. Seiser. 1997. Identification of mouse histone deacetylase 1 as a growth factor-inducible gene. Mol. Cell. Biol. 17:5033-5043. - PMC - PubMed
    1. Chadee, D. N., M. J. Hendzel, C. P. Tylipski, C. D. Allis, D. P. Bazett Jones, J. A. Wright, and J. R. Davie. 1999. Increased Ser-10 phosphorylation of histone H3 in mitogen-stimulated and oncogene-transformed mouse fibroblasts. J. Biol. Chem. 274:24914-24920. - PubMed
    1. Cheung, P., C. D. Allis, and P. Sassone-Corsi. 2000. Signaling to chromatin through histone modifications. Cell 103:263-271. - PubMed
    1. Cheung, P., K. G. Tanner, W. L. Cheung, P. Sassone Corsi, J. M. Denu, and C. D. Allis. 2000. Synergistic coupling of histone H3 phosphorylation and acetylation in response to epidermal growth factor stimulation. Mol. Cell 5:905-915. - PubMed

Publication types

MeSH terms