. 2002 Nov;22(22):8056-66.
doi: 10.1128/MCB.22.22.8056-8066.2002.

High osmolarity extends life span in Saccharomyces cerevisiae by a mechanism related to calorie restriction

Affiliations

High osmolarity extends life span in Saccharomyces cerevisiae by a mechanism related to calorie restriction

Matt Kaeberlein et al. Mol Cell Biol. 2002 Nov.

Abstract

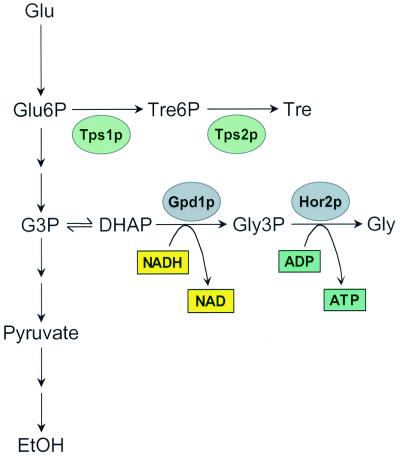
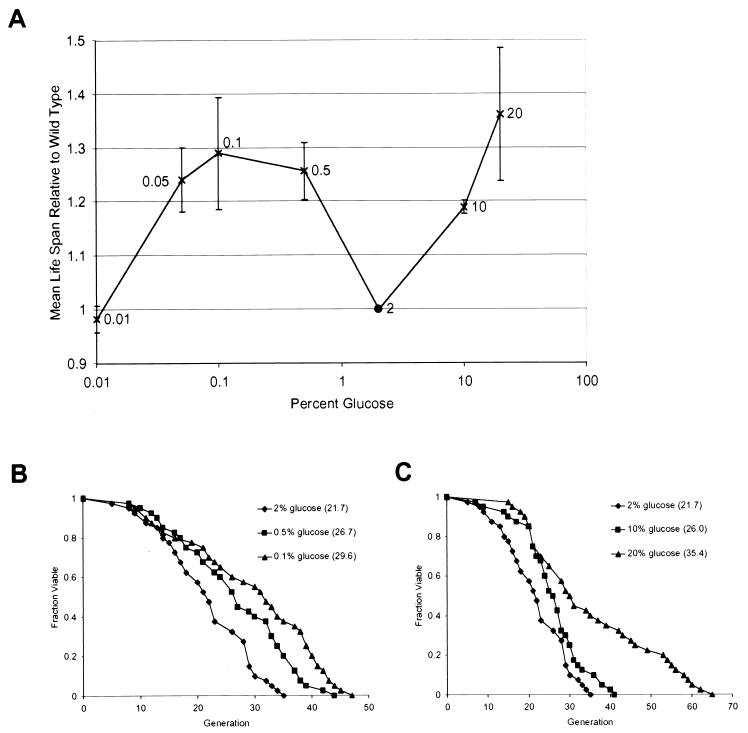
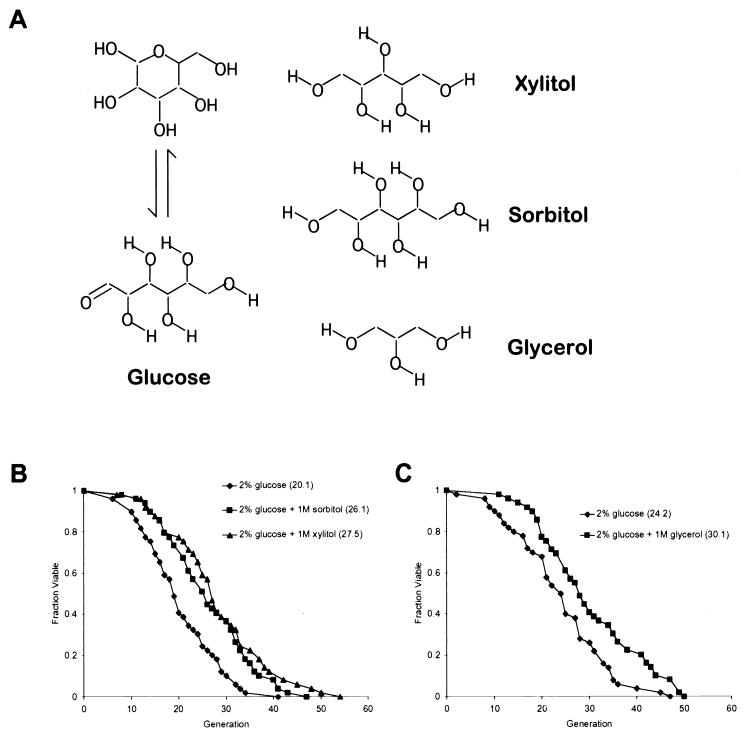
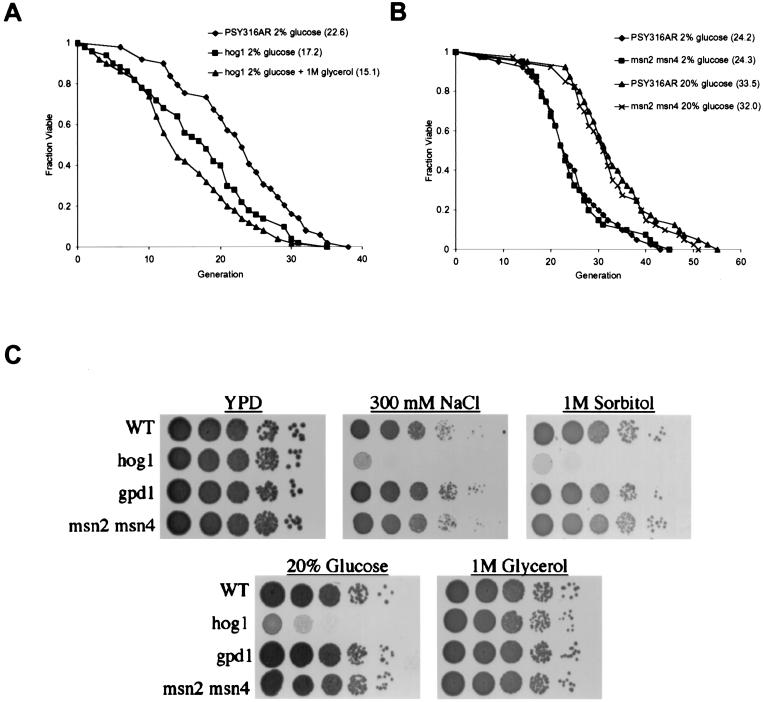
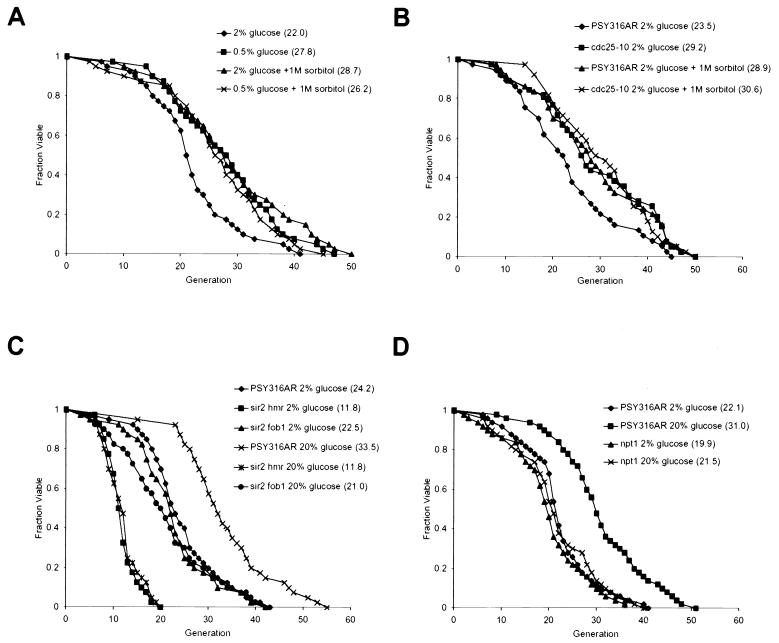
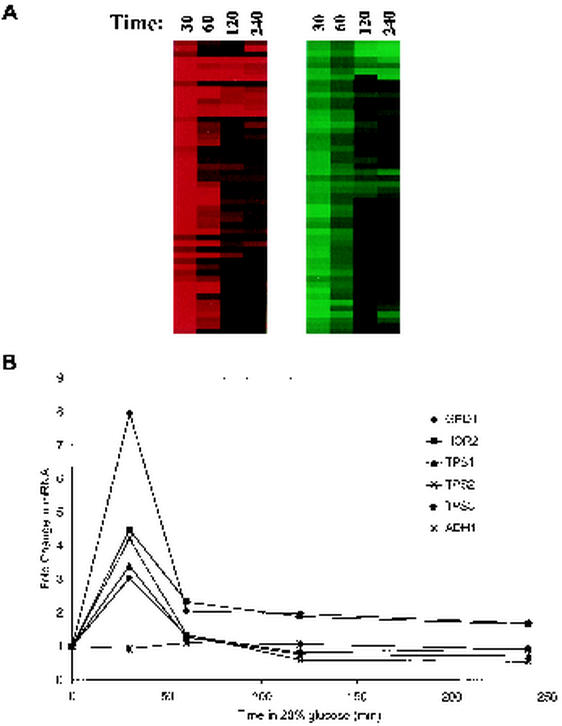
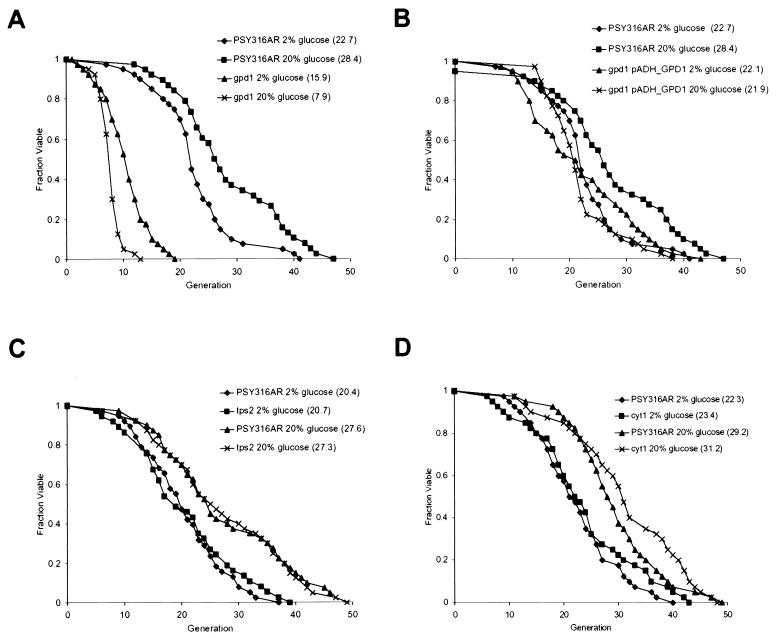
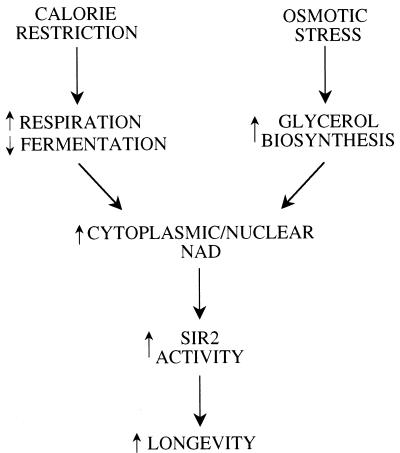
Calorie restriction (CR) extends life span in many different organisms, including mammals. We describe here a novel pathway that extends the life span of Saccharomyces cerevisiae mother cells but does not involve a reduction in caloric content of the media, i.e., there is growth of yeast cells in the presence of a high concentration of external osmolytes. Like CR, this longevity-promoting response to high osmolarity requires SIR2, suggesting a common mechanism of life span regulation. Genetic and microarray analysis indicates that high osmolarity extends the life span by activating Hog1p, leading to an increase in the biosynthesis of glycerol from glycolytic intermediates. This metabolic shift likely increases NAD levels, thereby activating Sir2p and promoting longevity.


Figures

FIG. 1.
FIG. 1.
High osmolarity results in a metabolic shift away from glycolysis. Activation of the HOG response pathway results in biosynthesis of trehalose and glycerol from glycolytic intermediates. Glu, glucose; P, phosphate; Tre, trehalose; G3P, glyceraldehyde-3-phosphate; DHAP, dihydroxyacetone-3-phosphate; Gly, glycerol; EtOH, ethanol. The proteins shown are transcriptionally activated by Hog1p.
FIG. 2.
FIG. 2.
Life span varies as a function of glucose concentration. (A) Mean life span is plotted as a function of the glucose concentration. Error bars represent standard deviations obtained from at least three experiments (n ≥ 40 cells per experiment). (B) Life spans were determined for 2% glucose (♦), 0.5% glucose (▪), and 0.1% glucose (▴). Mean life spans (numbers of cells analyzed) were as follows: 2% glucose, 21.7 generations (n = 40); 0.5% glucose, 26.7 generations (n = 40); and 0.1% glucose, 29.6 generations (n = 40). (C) Life spans were determined for 2% glucose (♦), 10% glucose (▪), and 20% glucose (▴). Mean life spans (numbers of cells analyzed) were as follows: 2% glucose, 21.7 generations (n = 40); 10% glucose, 26.0 generations (n = 40); and 20% glucose, 35.4 generations (n = 40).
FIG. 3.
FIG. 3.
Growth in the presence of high osmolarity extends life span. (A) Structures of glucose, xylitol, sorbitol, and glycerol. (B) Life spans were determined for 2% glucose (♦), 2% glucose plus 1 M sorbitol (▪), and 2% glucose plus 1 M xylitol (▴). Mean life spans (numbers of cells analyzed) were as follows: 2% glucose, 20.1 generations (n = 49); 2% glucose plus 1 M sorbitol, 26.1 generations (n = 49); and 2% glucose plus 1 M xylitol, 27.5 generations (n = 49). (C) Life spans were determined for 2% glucose (♦) and 2% glucose plus 1 M glycerol (▪). Mean life spans (numbers of cells analyzed) were as follows: 2% glucose, 24.2 generations (n = 50); and 2% glucose plus 1 M glycerol, 30.1 generations (n = 49).
FIG. 4.
FIG. 4.
The HOG response is required for life span extension by high osmolarity. (A) Life spans were determined for strain PSY316AR in 2% glucose (♦), the hog1 mutant in 2% glucose (▪), and the hog1 mutant in 2% glucose plus 1 M glycerol (▴). Mean life spans (numbers of cells analyzed) were as follows: PSY316AR 2% glucose, 22.6 generations (n = 49); hog1 2% glucose, 17.2 generations (n = 50); and hog1 2% glucose plus 1 M glycerol, 15.1 generations (n = 50). (B) Life spans were determined for strain PSY316AR in 2% glucose (♦), the msn2 msn4 mutant in 2% glucose (▪), strain PSY316AR in 20% glucose (▴), and the msn2 msn4 mutant in 20% glucose (x). Mean life spans (numbers of cells analyzed) were as follows: PSY316AR 2% glucose, 24.2 generations (n = 40); msn2 msn4 2% glucose, 24.3 generations (n = 40); PSY316AR 20% glucose, 33.5 generations (n = 40); and msn2 msn4 20% glucose, 32.0 generations (n = 40). (C) Serial dilution spot assays onto high-osmolarity media. Mutation of HOG1 results in sensitivity to high concentrations of glucose or sorbitol, but not glycerol. Mutation of GPD1 or MSN2 and MSN4 has no detectable effect on sensitivity to high osmolarity.
FIG. 5.
FIG. 5.
High osmolarity, CR, and Sir2p are in the same pathway for regulation of life span. (A) Life spans were determined for PSY316AR in 2% glucose (♦), PSY316AR in 0.5% glucose (▪), PSY316AR in 2% glucose plus 1 M sorbitol (▴), and PSY316AR in 0.5% glucose plus 1 M sorbitol (x). Mean life spans (numbers of cells analyzed) were as follows: PSY316AR 2% glucose, 22.0 generations (n = 40); PSY316AR 0.5% glucose, 27.8 generations (n = 40); PSY316AR 2% glucose plus 1 M sorbitol, 28.7 generations (n = 40); and PSY316AR 0.5% glucose plus 1 M sorbitol, 26.2 generations (n = 40). (B) Life spans were determined for PSY316AR in 2% glucose (♦), the cdc25-10 mutant in 2% glucose (▪), PSY316AR in 2% glucose plus 1 M sorbitol (▴), and the cdc25-10 mutant in 2% glucose plus 1 M sorbitol (x). Mean life spans (numbers of cells analyzed) were as follows: PSY316AR 2% glucose, 23.5 generations (n = 37); cdc25-10 2% glucose, 29.2 generations (n = 39); PSY316AR 2% glucose plus 1 M sorbitol, 28.9 generations (n = 37); and cdc25-10 2% glucose plus 1 M sorbitol, 30.6 generations (n = 39). (C) Life spans were determined for PSY316AR in 2% glucose (♦), the sir2 hmr mutant in 2% glucose (▪), the sir2 fob1 mutant in 2% glucose (▴), PSY316AR in 20% glucose (x), the sir2 hmr mutant in 20% glucose (∗), and the sir2 fob1 mutant in 20% glucose (•). Mean life spans (numbers of cells analyzed) were as follows: PSY316AR 2% glucose, 24.2 generations (n = 40); sir2 hmr 2% glucose, 11.8 generations (n = 40); sir2 fob1 2% glucose, 22.5 generations (n = 40); PSY316AR 20% glucose, 33.5 generations (n = 40) sir2 hmr 20% glucose, 11.8 generations (n = 40); and sir2 fob1 20% glucose, 21.0 generations (n = 40). In this experiment, HMLa was deleted from sir2 strains to prevent a and α coexpression, which has been demonstrated to shorten life span in haploid cells (21). (D) Life spans were determined for PSY316AR in 2% glucose (♦), PSY316AR in 20% glucose (▪), the npt1 mutant in 2% glucose (▴), and the npt1 mutant in 20% glucose (x). Mean life spans (numbers of cells analyzed) were as follows: PSY316AR 2% glucose, 22.1 generations (n = 50); PSY316AR 20% glucose, 31.0 generations (n = 50); npt1 2% glucose, 19.9 generations (n = 50); and npt1 20% glucose, 21.5 generations (n = 50).
FIG. 6.
FIG. 6.
Microarray analysis of cells exposed to 20% glucose. (A) Graphic display of a subset of the genes down-regulated (green) and up-regulated (red) by high osmolarity after 30, 60, 120, or 240 min of growth in 20% glucose. Many, but not all, regulated genes peak between 30 and 60 min after exposure to osmotic stress. Data values can be found online at http://web.mit.edu/biology/guarente/arrays/kaeberlein.html. (B) Glycerol and trehalose biosynthetic genes are up-regulated by growth in 20% glucose. GPD1 and HOR2 mRNA levels decline after 30 min of exposure to 20% glucose but are still expressed above uninduced levels even after 4 h. TPS1, TPS2, and TPS3 mRNA levels are up-regulated after 30 min but return to uninduced levels after 1 h. ADH1 mRNA is shown as an uninduced control.
FIG. 7.
FIG. 7.
Life span extension by high osmolarity requires increased expression of enzymes involved in biosynthesis of glycerol but not trehalose. (A) Life spans were determined for PSY316AR in 2% glucose (♦), PSY316AR in 20% glucose (▪), the gpd1 mutant in 2% glucose (▴), and the gpd1 mutant in 20% glucose (x). Mean life spans (numbers of cells analyzed) were as follows: PSY316AR 2% glucose, 22.7 generations (n = 40); PSY316AR 20% glucose, 28.4 generations (n = 38); gpd1 2% glucose, 15.9 generations (n = 40); and gpd1 20% glucose, 7.9 generations (n = 40). (B) Life spans were determined for PSY316AR in 2% glucose (♦), PSY316AR in 20% glucose (▪), the gpd1 pADH_GPD1 mutant in 2% glucose (▴), and the gpd1 pADH_GPD1 mutant in 20% glucose (x). Mean life spans (numbers of cells analyzed) were as follows: PSY316AR 2% glucose, 22.7 generations (n = 40); PSY316AR 20% glucose, 28.4 generations (n = 38); gpd1 pADH_GPD1 2% glucose, 22.1 generations (n = 40); and gpd1 pADH_GPD1 20% glucose, 21.9 generations (n = 40). (C) Life spans were determined for PSY316AR in 2% glucose (♦), the tps2 mutant in 2% glucose (▪), PSY316AR in 20% glucose (▴), and the tps2 mutant in 20% glucose (x). Mean life spans (numbers of cells analyzed) were as follows: PSY316AR 2% glucose, 20.4 generations (n = 37); tps2 2% glucose, 20.7 generations (n = 38); PSY316AR 20% glucose, 27.6 generations (n = 40); and tps2 20% glucose, 27.3 generations (n = 40). (D) Life spans were determined for PSY316AR in 2% glucose (♦), the cyt1 mutant in 2% glucose (▪), PSY316AR in 20% glucose (▴), and the cyt1 mutant in 20% glucose (x). Mean life spans (numbers of cells analyzed) were as follows: PSY316AR 2% glucose, 22.3 generations (n = 40); cyt1 2% glucose, 23.4 generations (n = 40); PSY316AR 20% glucose, 29.2 generations (n = 40); and cyt1 20% glucose, 31.2 generations (n = 40).
FIG. 8.
FIG. 8.
CR and high osmolarity both extend life span by activation of Sir2p through altered NAD metabolism. A model in which both CR and osmotic stress promote long life span by activating Sir2p is shown. In both cases, activation of Sir2p is mediated through an increase in the NAD available for Sir2p to use as a substrate for histone deacetylation. Under conditions of CR, this is accomplished by a metabolic shift from fermentation to respiration (24). Growth in the presence of high osmolarity could increase cytoplasmic NAD by upregulation of glycerol biosynthesis.

References

    1. Albertyn, J., S. Hohmann, J. M. Thevelein, and B. A. Prior. 1994. GPD1, which encodes glycerol-3-phosphate dehydrogenase, is essential for growth under osmotic stress in Saccharomyces cerevisiae, and its expression is regulated by the high-osmolarity glycerol response pathway. Mol. Cell. Biol. 14:4135-4144. - PMC - PubMed
    1. Alepuz, P. M., A. Jovanovic, V. Reiser, and G. Ammerer. 2001. Stress-induced map kinase Hog1 is part of transcription activation complexes. Mol. Cell 7:767-777. - PubMed
    1. Anderson, R. M., K. J. Bitterman, J. G. Wood, O. Medvedik, H. Cohen, S. S. Lin, J. K. Manchester, J. I. Gordon, and D. A. Sinclair. 2002. Manipulation of a nuclear NAD+ salvage pathway delays aging without altering steady-state NAD+ levels. J. Biol. Chem. 277:18881-18890. - PubMed
    1. Armstrong, C. M., M. Kaeberlein, S. Imai, and L. Guarente. 2002. Mutations in Saccharomyces cerevisiae gene SIR2 can have differential effects on in vivo silencing phenotypes and in vitro histone deacetylation activity. Mol. Biol. Cell 13:1427-1438. - PMC - PubMed
    1. Bell, M., R. Capone, I. Pashtan, A. Levitzki, and D. Engelberg. 2001. Isolation of hyperactive mutants of the MAPK p38/Hog1 that are independent of MAPK kinase activation. J. Biol. Chem. 276:25351-25358. - PubMed

Publication types

MeSH terms

LinkOut - more resources