. 2002 Oct 29;99(22):14458-63.
doi: 10.1073/pnas.212148999. Epub 2002 Oct 21.

Multiple spatiotemporal modes of actin reorganization by NMDA receptors and voltage-gated Ca2+ channels

Affiliations

Multiple spatiotemporal modes of actin reorganization by NMDA receptors and voltage-gated Ca2+ channels

Tomoyuki Furuyashiki et al. Proc Natl Acad Sci U S A. .

Abstract

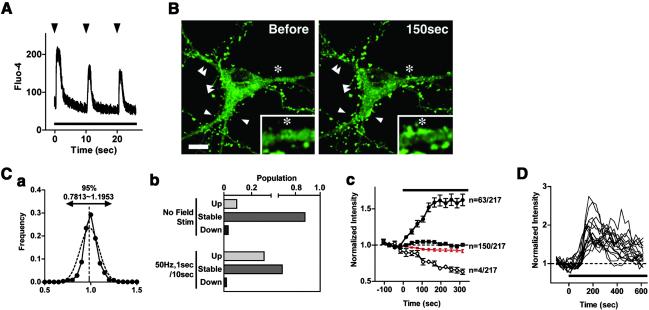
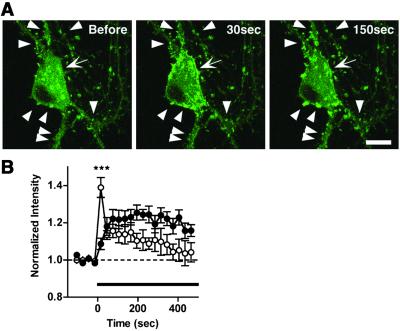
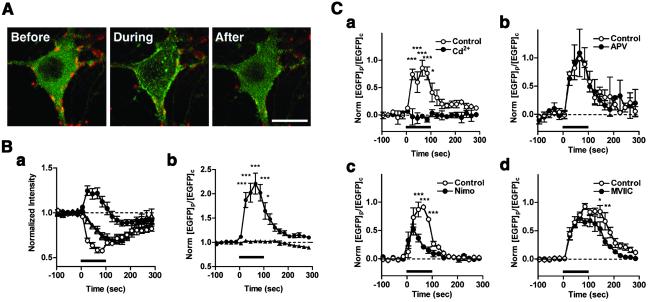
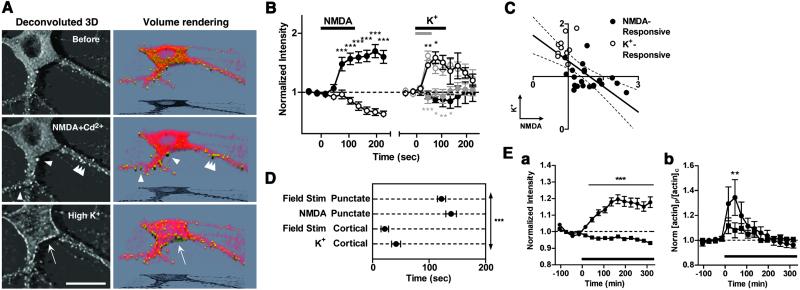
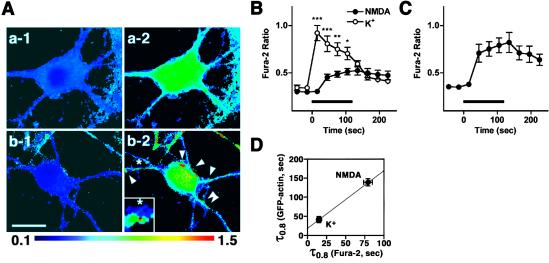
Cytoskeleton is believed to contribute to activity-dependent processes underlying neuronal plasticity, such as regulations of cellular morphology and localization of signaling proteins. However, how neuronal activity controls actin cytoskeleton remains obscure. Taking advantage of confocal imaging of enhanced GFP-actin in the primary culture of hippocampal neurons, we show that synaptic activity induces multiple types of actin reorganization, both at the spines and at the somatic periphery. Activation of N-methyl-d-aspartate receptors, accompanied with a local rise in [Ca(2+)]i, was sufficient to trigger a slow and sustained recruitment of actin into dendritic spines. In contrast, opening of voltage-gated Ca(2+) channels rapidly and reversibly enhanced cortical actin at the somatic periphery but not in the spines, in keeping with a high transient rise in somatic [Ca(2+)]i. These data suggest that spatiotemporal dynamics of [Ca(2+)]i, triggered by activation of N-methyl-d-aspartate receptors and voltage-gated Ca(2+) channels, provides the molecular basis for activity-dependent actin remodeling.


Figures

Fig 1.
Fig 1.
Electrically patterned synaptic activity induces enhancement of actin puncta in spine-like structures. (A) The fluorescence intensity of Fluo-4 in a neuronal cell body was measured in the line-scan mode. Trains at 9-s intervals (arrowheads) were continuously applied by using field stimulation electrodes throughout the duration of the recording (bar). (B) Significant numbers of punctate accumulation of EGFP-actin (arrowheads) were detected at the 150-s time point during the same stimulus train as in A. The magnified and smoothed image is shown in Inset. **, same position. (Bar = 10 μm.) See also Movie 1. (Ca) Distribution of basal EGFP-actin fluorescence (solid line) and its Gaussian-fitted curve (dotted line). EGFP-actin fluorescence intensity was normalized to average intensity. Ninety-five percent of puncta were included in the 0.7813–1.1953 interval (mean ± 2 SD). (Cb) Electrical field stimulation augments the number of puncta with a fluorescence increase greater to 2 SD (“Up”, >1.1953-fold of the mean) while diminishing the number of puncta with a lesser increase (“Stable”, changes smaller than 2 SD; “Down”, decrease greater than 2 SD). Two hundred and seventeen puncta from 8 stimulated neurons and 65 puncta from 4 unstimulated neurons were analyzed. (Cc) Temporal profiles of averaged fluorescence intensity in the three categories (“Up”, •; “Stable”, ▪; “Down”, ○). The total integrated fluorescence from all pixels in the soma area is also shown (red line). (D) Individual traces of EGFP-actin fluorescence from 18 puncta showing fluorescence increase (>SD) in a single representative neuron. The same stimulus as in A was applied (bar). Data are shown as means ± SEM.
Fig 2.
Fig 2.
Rapid induction and decay of cortical actin enhancement is also triggered by patterned synaptic activity. (A) A representative neuron showing both cortical (arrow) and punctate (arrowheads) accumulations of EGFP-actin. (Bar = 10 μm.) (B) Punctate (•, 16 ROIs from 2 neurons) and cortical (○, 9 ROIs from 2 neurons) actin accumulations revealed a striking difference in activation and decay kinetics during the whole duration of the field stimulation (shown by bar). All data are shown as means ± SEM. ***, P < 0.001.
Fig 3.
Fig 3.
High K+-induced depolarization elicited rapid and reversible accumulation of EGFP-actin to the somatic periphery through the opening of voltage-gated Ca2+ channels. (A) EGFP-actin (green) distribution before, during, and after depolarization with 90 mM K+ in a hippocampal neuron, with a simultaneous recording of the decay of FM4–64 signals (red). See also Movie 2. (Bar = 15 μm.) (Ba) Traces of EGFP-actin (13 neurons, • and ○) or EGFP (4 neurons, ▴ and ▵) intensity at the somatic periphery (the single brightest ROI at the edge of the EGFP-actin signals at the soma, • and ▴) and the bulk cytoplasm (the single darkest ROI at the perinuclear region, ○ and ▵). (b) The ratio of the fluorescence intensity at the somatic periphery and the bulk cytoplasm ([EGFP]p/[EGFP]c), normalized to the value before stimulation, as the translocation index for EGFP signals (•, EGFP-actin; ▴, EGFP). (C ad) The dependence of high K+-induced increases in [EGFP]p/[EGFP]c on various Ca2+ influx sources was examined in the absence (○) or presence (•) of various reagents such as 100 μM Cd2+ (a, 4 neurons), 50 μM D-APV (b, 3 neurons), 10 μM nimodipine (c, 3 neurons), or 5 μM ω-conotoxin MVIIC (d, 4 neurons). All data were rescaled based on the peak value during the control depolarization (○), applied 10 min before the second depolarization in the presence of the reagents (•). Repeated depolarization reliably induced the cortical actin accumulation (data not shown). Stimulus duration was shown by bar for each dataset. *, P < 0.05; **, P < 0.01; ***, P < 0.001. All of the plots are shown in means ± SEM.
Fig 4.
Fig 4.
Activation of NMDA receptors induced actin accumulation to the dendritic spines, but not to the somatic periphery. (A Left) Deconvoluted 3-D images of typical EGFP-actin distribution within the same hippocampal neuron, before (Before), after NMDA application with Cd2+ (NMDA+Cd2+), and after a subsequent high K+ depolarization following washout of NMDA and Cd2+ (High K+). See also Movie 3. (Bar = 20 μm.) (A Right) A 3-D-rendered pseudocolor illustration of the distribution of NMDA-induced and high K+-induced EGFP-actin accumulations in the panels at Left. EGFP-actin-enriched structures are illustrated in yellow; they are based on the arbitrary threshold (arrowheads and an arrow). The signals of EGFP-actin below the threshold are shown in red. (B) Temporal profiles of averaged EGFP-actin fluorescence at typical NMDA-responsive (•, 22 ROIs from 3 neurons) or high K+-responsive (○, 10 ROIs from 3 neurons) regions. An increase exceeding 2 SD was considered as a significant response. High K+ did not alter the fluorescence intensity at EGFP-actin puncta, irrespective of the stimulus duration (2 min, black, 1 neuron; 1 min, gray, 2 neurons). (C) Correlative plots of each individual ROI in B. Increases in EGFP-actin fluorescence during stimulation with NMDA (at 105 s) and with high K+ (at 45 s) at either the NMDA-responsive or the high K+-responsive regions are compared. Note that there are two distinct clusters with different responsiveness toward each stimulus. The responsiveness to NMDA and to high K+ shows a negative correlation (slope of linear regression = −0.4855 ± 0.1181, P < 0.001, F test). The dotted line shows a 95% confidence interval for linear regression. (D) Averaged 0–80% rising times (τ0.8) are calculated and compared for the cortical and punctate actin accumulations induced by field stimulation and for NMDA- and high K+-stimulation. (E) The punctate actin accumulation (a) was abolished in the presence of D-APV (50 μM or 100 μM, ▪, 150 puncta from 10 neurons; •, control trace). The cortical accumulation (b), which is quantified in the translocation index of [EGFP]p/[EGFP]c as in Fig. 3, was still induced by field stimulation in the presence of D-APV, although to a significantly lesser degree [11 neurons each with (▪) or without (•) D-APV]. Data is shown as means ± SEM. *, P < 0.05; **, P < 0.01; ***, P < 0.001. Bars indicate stimulus duration.
Fig 5.
Fig 5.
Spatial and temporal Ca2+ dynamics is tightly linked with activity-dependent actin reorganization following high K+ and NMDA-stimuli. (A) Ratiometric measurements of Fura-2 fluorescence excited at 340 nm and at 380 nm before (a-1, b-1) and at 105 s during stimuli (a-2, b-2) in neurons stimulated with high K+ (a), and in those stimulated with NMDA in the absence of Mg2+ and in the presence of nimodipine (b). All Ca2+ imaging was performed in the presence of 5 μM ω-conotoxin MVIIC to avoid the contamination of large Ca2+ increase at presynaptic terminals. Localized Ca2+ transients (b-2, white arrowheads) were observed only in NMDA-stimulated cells. Stimulus duration was 2 min for each stimulus. A magnified and smoothed view of a typical local dendritic Ca2+ rise is shown in Inset. The asterisk in each image shows the same position. (B) Comparison of Ca2+ transients at the somatic periphery upon high K+ (○, 4 neurons) or NMDA (•, 11 neurons) stimulation. Note the distinction in the amplitude and the kinetics of the two responses. (C) Slow but robust Ca2+ transients are induced at localized puncta in the dendrites and the soma upon NMDA activation—36 ROIs from 11 neurons. (D) Correlation between τ0.8 for induced Ca2+ transients and actin responses. Data are shown as means ± SEM. *, P < 0.05; **, P < 0.01; ***, P < 0.001. Bars indicate stimulus durations.

Similar articles

Cited by

References

    1. Andersen P. (1999) Nature 399, 19-21. - PubMed
    1. Smith S. J. (1999) Science 283, 1860-1861. - PubMed
    1. Blackstone C. & Sheng, M. (1999) Cell Calcium 26, 181-192. - PubMed
    1. Bliss T. V. & Collingridge, G. L. (1993) Nature 361, 31-39. - PubMed
    1. Kennedy M. B. (1998) Brain Res. Brain Res. Rev. 26, 243-257. - PubMed

Publication types

MeSH terms

LinkOut - more resources