

doi: 10.1073/pnas.222561199.
Epub 2002 Oct 22.
Transcriptome analysis during cell division in plants
Affiliations
- PMID: 12393816
- PMCID: PMC137503
- DOI: 10.1073/pnas.222561199
Item in Clipboard
Transcriptome analysis during cell division in plants
Proc Natl Acad Sci U S A.
.
Abstract
Using synchronized tobacco Bright Yellow-2 cells and cDNA-amplified fragment length polymorphism-based genomewide expression analysis, we built a comprehensive collection of plant cell cycle-modulated genes. Approximately 1,340 periodically expressed genes were identified, including known cell cycle control genes as well as numerous unique candidate regulatory genes. A number of plant-specific genes were found to be cell cycle modulated. Other transcript tags were derived from unknown plant genes showing homology to cell cycle-regulatory genes of other organisms. Many of the genes encode novel or uncharacterized proteins, indicating that several processes underlying cell division are still largely unknown.
Figures

Hierarchical clustering of cell cycle-modulated transcript tags. Only the tags with a significant homology to a known sequence are included. Each row represents a tag with the relative transcript accumulation patterns shown over the 12 consecutive time points (columns). Red and green reflect, respectively, transcriptional activation and repression relative to the average expression level over the time course; gray represents missing data. The dendrogram shows the relationships between clusters of genes with similar expression pattern. The main clusters, corresponding to the different cell cycle phases, are indicated on the right. The full cluster based on the entire data set can be obtained at www.psb.rug.ac.be/papers/pebre/pnas.htm .
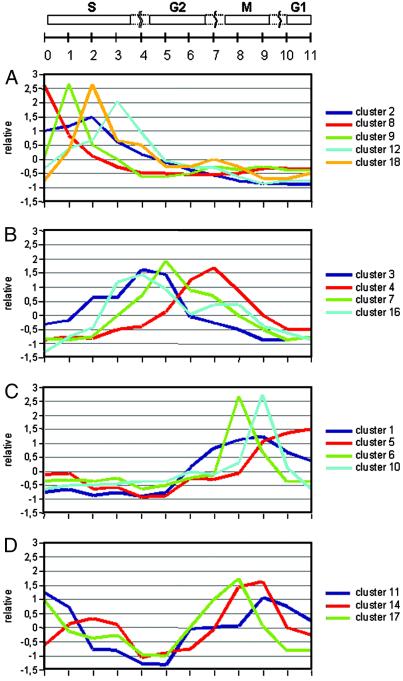
Gene expression profiles obtained by quality-based clustering of all transcript tags. Shown are the trend lines of 16 clusters containing 97% of the genes and covering the entire time course as indicated at the top. S phase-specific gene clusters are grouped in A, gene clusters with peak expression between S and M phases in B, and the M and G1 phase-specific clusters in C. (D) Three small clusters of genes with peak expression during two cell cycle phases. An overview of the complete clusters can be obtained at www.psb.rug.ac.be/papers/pebre/pnas.htm .
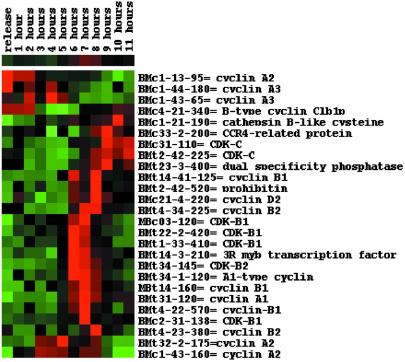
Expression profiles and hierarchical clustering of the main known and putative core cell cycle genes. The identity of each tag is given on the right.
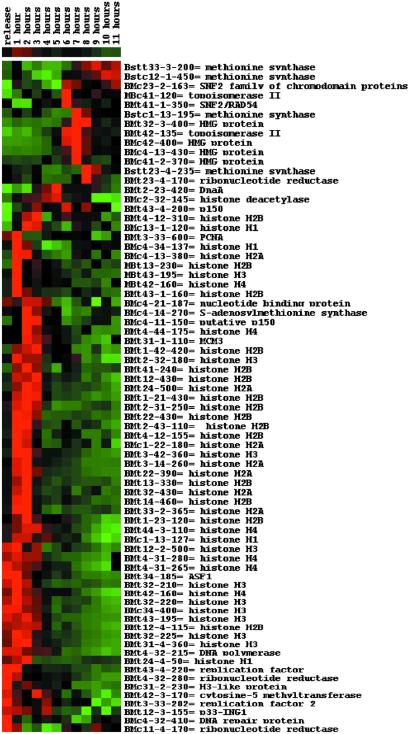
Hierarchical clustering of transcript tags derived from genes involved in DNA replication and modification. The identity of each tag is given on the right.
References
-
- Cho R. J., Huang, M., Campbell, M. J., Dong, H., Steinmetz, L., Sapinoso, L., Hampton, G., Elledge, S. J., Davis, R. W. & Lockhart, D. J. (2001) Nat. Genet. 27, 48-54. - PubMed
-
- Stals H. & Inzé, D. (2001) Trends Plant Sci. 6, 359-364. - PubMed
-
- den Boer B. G. W. & Murray, J. A. H. (2000) Trends Cell Biol. 10, 245-250. - PubMed
-
- Smith L. G. (1999) Curr. Opin. Plant Biol. 2, 447-453. - PubMed
Publication types
MeSH terms
Substances
LinkOut - more resources
Full Text Sources
Other Literature Sources
