. 2002 Oct;110(8):1133-9.
doi: 10.1172/JCI16413.

Collagen deposition in HIV-1 infected lymphatic tissues and T cell homeostasis

Affiliations

Collagen deposition in HIV-1 infected lymphatic tissues and T cell homeostasis

Timothy W Schacker et al. J Clin Invest. 2002 Oct.

Abstract

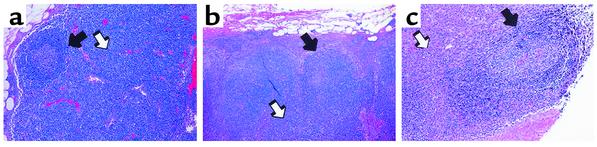
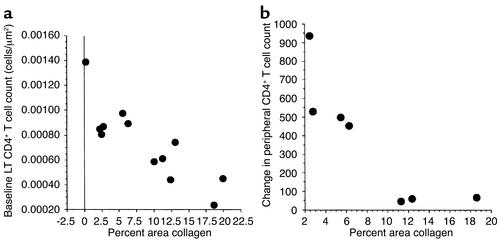
Lymphatic tissues (LTs) are structurally organized to promote interaction between antigens, chemokines, growth factors, and lymphocytes to generate an immunologic response and maintain normal-sized populations of CD4(+) and CD8(+) T cells. Inflammation and tissue remodeling that accompany local innate and adaptive immune responses to HIV-1 replication cause damage to the LT architecture. As a result, normal populations of CD4(+) and CD8(+) T cells cannot be supported and antigen-lymphocyte interactions are impaired. This conclusion is supported herein following LT sampling before and during anti-HIV therapy in persons with acute, chronic, and late-stage HIV-1 infection. Among seven individuals treated with anti-retroviral therapy (ART) and four individuals deferring therapy we found evidence of significant paracortical T cell zone damage associated with deposition of collagen, the extent of which was inversely correlated with both the size of the LT CD4(+) T cell population and the change in peripheral CD4(+) T cell count with anti-HIV therapy. The HIV-1-associated inflammatory changes and scarring in LT both limit the ability of the tissue to support and reestablish normal-sized populations of CD4(+) T cells and suggest a novel mechanism of T cell depletion that may explain the failure of ART to significantly increase CD4(+) T cell populations in some HIV-1-infected persons.


Figures

Figure 1
Figure 1
Histologic changes in B cell follicles and TZ characteristic of HIV-1 infection. (a) Section of lymph node from an HIV-negative patient. There is one B cell follicle that is normal in size and shape (black arrow). The TZ is normal in size with a normal population of cells (white arrow). (b) Section of a lymph node from an HIV-1–infected patient with presymptomatic HIV-1 infection. The follicles are hyperplastic and disorganized (black arrow), and the TZ is small and somewhat depleted of cells (white arrow). (c) Lymph node section from a patient with AIDS. The follicular space is disorganized and without structure (black arrow), and the TZ is unrecognizable with few cells (white arrow). All images are at a magnification of ×4.
Figure 2
Figure 2
Comparison of peripheral versus LT CD4+ T cell population at baseline shows no significant relationship.
Figure 3
Figure 3
Quantitative analysis of collagen deposition in the TZ in HIV-1–infected persons. Tissues were stained with a modified trichrome stain using the Masson method to identify collagen fibers as blue. (a) HIV-negative patient. Collagen makes up 0.23% of the tissue section. (b) Patient 1407. Section shows collagen deposition (stained blue) in the wall of the high endothelial venule. Percent area collagen was calculated to be 2.2%. (c) Patient 1327, the patient with AIDS. In contrast to b, this section shows significant deposition of collagen in the TZ. Percent area collagen was calculated to be 18.6%. A total of 18 images from each tissue sample, imported through the Photoshop program (Adobe, Version 6.0), are displayed (magnification, ×40). (d) The transformed Photoshop image from c. All shades of blue representing collagen in c were averaged and displayed in black; non-collagen area was removed. This image was imported into the MetaMorph imaging program and the percent area in black was calculated.
Figure 4
Figure 4
Relationship between the percentage of LT occupied by collagen and two parameters: baseline LT CD4+ T cell population and change in peripheral CD4+ T cell count after 6 months. (a) Size of the baseline LT CD4+ T cell population is compared with the percent area of the TZ occupied by collagen. There is a significant correlation between these values (R2 = 0.72, P < 0.0001, Spearman rank correlation). (b) Change in the peripheral CD4+ T cell population after 6 months of HAART is compared with the percent area of the TZ occupied by collagen. There is significant correlation between these measurements (R2 = 0.91, P < 0.001).

References

    1. Kaldjian EP, Gretz JE, Anderson AO, Shi Y, Shaw S. Spatial and molecular organization of lymph node T cell cortex: a labyrinthine cavity bounded by an epithelium-like monolayer of fibroblastic reticular cells anchored to basement membrane-like extracellular matrix. Int Immunol. 2001;13:1243–1253. - PubMed
    1. Gretz JE, Kaldjian EP, Anderson AO, Shaw S. Sophisticated strategies for information encounter in the lymph node: the reticular network as a conduit of soluble information and a highway for cell traffic. J Immunol. 1996;157:495–499. - PubMed
    1. Gretz JE, Norbury CC, Anderson AO, Proudfoot AE, Shaw S. Lymph-borne chemokines and other low molecular weight molecules reach high endothelial venules via specialized conduits while a functional barrier limits access to the lymphocyte microenvironments in lymph node cortex. J Exp Med. 2000;192:1425–1440. - PMC - PubMed
    1. Zhang ZQ, et al. Kinetics of CD4+T cell repopulation of lymphoid tissues after treatment of HIV-1 infection. Proc Natl Acad Sci USA. 1998;95:1154–1159. - PMC - PubMed
    1. Campbell DJ, Butcher EC. Rapid acquisition of tissue-specific homing phenotypes by CD4(+) T cells activated in cutaneous or mucosal lymphoid tissues. J Exp Med. 2002;195:135–141. - PMC - PubMed

Publication types