

The observed human sperm mutation frequency cannot explain the achondroplasia paternal age effect
- PMID: 12397172
- PMCID: PMC137526
- DOI: 10.1073/pnas.232568699
The observed human sperm mutation frequency cannot explain the achondroplasia paternal age effect
Abstract
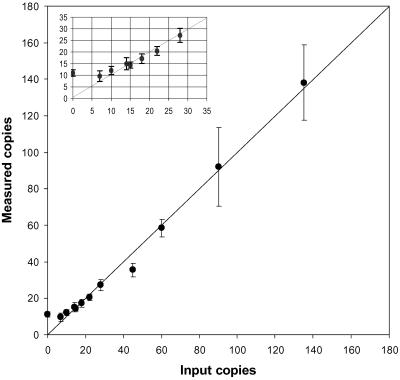
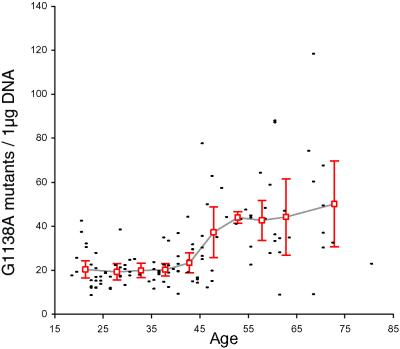
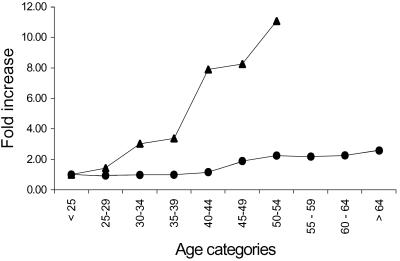
The lifelong spermatogonial stem cell divisions unique to male germ cell production are thought to contribute to a higher mutation frequency in males. The fact that certain de novo human genetic conditions (e.g., achondroplasia) increase in incidence with the age of the father is consistent with this idea. Although it is assumed that the paternal age effect is the result of an increasing frequency of mutant sperm as a man grows older, no direct molecular measurement of the germ-line mutation frequency has been made to confirm this hypothesis. Using sperm DNA from donors of different ages, we determined the frequency of the nucleotide substitution in the fibroblast growth factor receptor 3 (FGFR3) gene that causes achondroplasia. Surprisingly, the magnitude of the increase in mutation frequency with age appears insufficient to explain why older fathers have a greater chance of having a child with this condition. A number of alternatives may explain this discrepancy, including selection for sperm that carry the mutation or an age-dependent increase in premutagenic lesions that remain unrepaired in sperm and are inefficiently detected by the PCR assay.
Figures
References
-
- Vogel F. & Rathenberg, R. (1975) Adv. Hum. Genet. 5, 223-318. - PubMed
-
- Vogel F. & Motulsky, A. G., (1997) Human Genetics: Problems and Approaches (Springer, Berlin).
-
- Bohossian H. B., Skaletsky, H. & Page, D. C. (2000) Nature 406, 622-625. - PubMed
-
- Crow J. F. (2000) Nat. Rev. Genet. 1, 40-47. - PubMed
-
- Huttley G. A., Jakobsen, I. B., Wilson, S. R. & Easteal, S. (2000) Mol. Biol. Evol. 17, 929-937. - PubMed
MeSH terms
Substances
LinkOut - more resources
Full Text Sources
Molecular Biology Databases
Research Materials
