. 2002 Nov;184(22):6289-300.
doi: 10.1128/JB.184.22.6289-6300.2002.

Gene structure, organization, expression, and potential regulatory mechanisms of arginine catabolism in Enterococcus faecalis

Affiliations

Gene structure, organization, expression, and potential regulatory mechanisms of arginine catabolism in Enterococcus faecalis

Belén Barcelona-Andrés et al. J Bacteriol. 2002 Nov.

Abstract

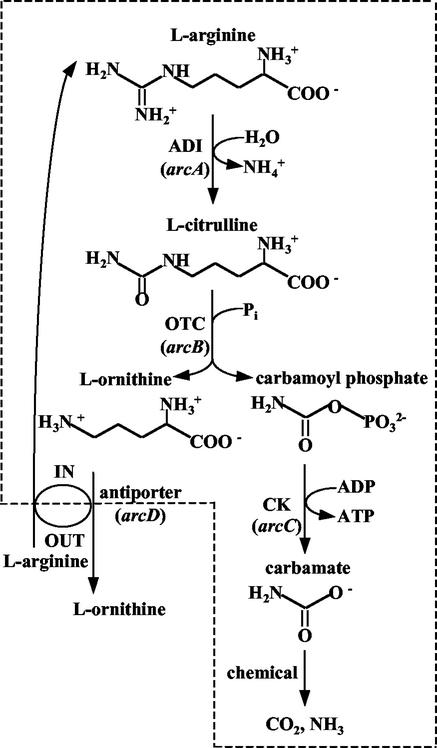
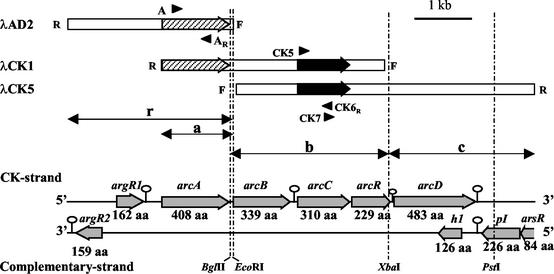
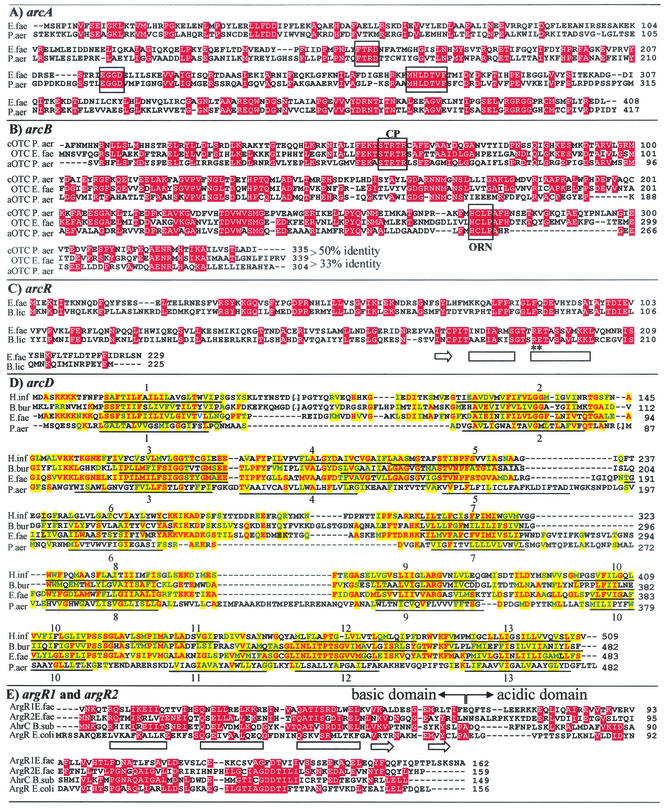
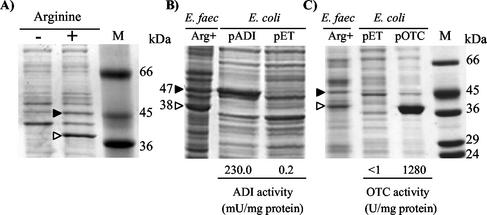
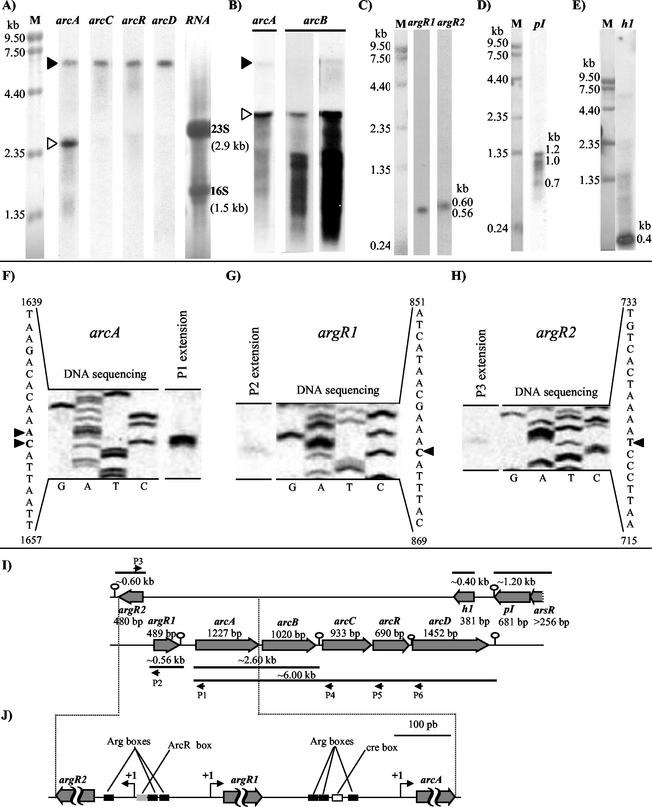
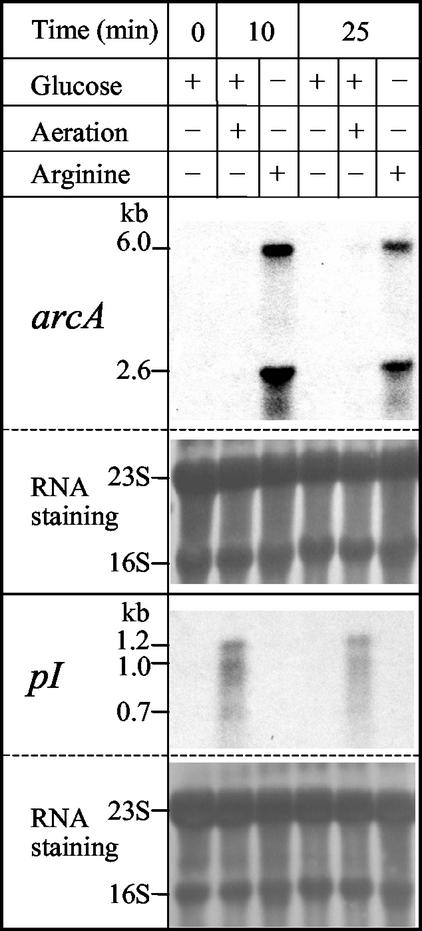
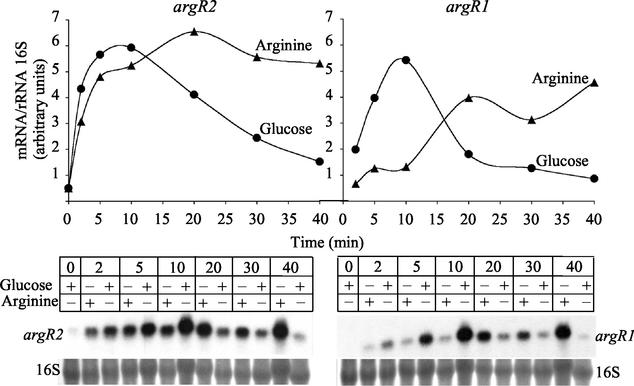
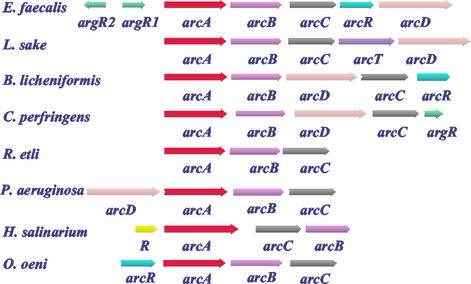
Although Enteroccus faecalis is the paradigm for biochemical studies on the arginine deiminase (ADI) pathway of fermentative arginine catabolism, little genetic information exists on this pathway in this organism. We fill this important gap by characterizing, in an 8,228-bp region cloned from a lambdagt11 genomic library of E. faecalis, a five-gene cluster forming a transcriptional unit (revealed by Northern blots and primer extension in E. faecalis) that corresponds to the ADI operon. Four additional genes in the opposite DNA strand and one in the same DNA strand are also identified. Studies on the protein products, including heterologous expression and/or sequence comparisons, allow us to ascertain or propose functions for all but 1 of the 10 genes. The ADI operon genes, arcABCRD, encode, respectively, ADI, ornithine transcarbamylase, carbamate kinase, a putative Crp/Fnr-type regulator (ArcR), and a putative ornithine-arginine antiporter (ArcD). Arginine induces the expression of arcABCRD, most likely by means of two homologous ArgR/AhrC-type regulators encoded by two genes, argR1 and argR2, that precede arcABCRD in each DNA strand and that are transcribed monocistronically, their transcription being influenced differentially by glucose and arginine. Potential ArgR1/ArgR2 (double and single) binding sequences are found in the promoter regions of arcA and of argR1/argR2 themselves. In addition, putative binding sequences for ArcR and for CcpA are found, respectively, in the argR1/argR2 and arcA promoter regions. Of the three other genes identified, two form a transcriptional unit and encode a putative metal-sensitive transcriptional regulator (ArsR) and a cysteine protease.


Figures

FIG. 1.
FIG. 1.
Arginine catabolism in E. faecalis. The broken line denotes the cell boundary, and IN and OUT denote intra- and extracellular medium. The relevant genes are given in italics.
FIG. 2.
FIG. 2.
Cloning of arcC and the surrounding genes in E. faecalis and gene organization of the sequenced region. The bars at the top illustrate to scale the inserts in isolated λgt11 clones, indicating the positions of arcA (striped arrow) and arcC (solid arrow) and the orientation of the inserts with respect to the flanking forward (F) and reverse (R) sequences of the cloning site in λgt11. Insert-specific primers used to characterize the constructions are shown as solid arrowheads and are named as described in Materials and Methods. The broken vertical lines give relevant restriction sites, some of which were used for subcloning of fragments r, a, b, and c (double-headed arrows). The bottom arrows schematize the gene organization of the two strands of the sequenced region, with indications of the number of amino acid (aa) residues expected for each gene product. The positions of the six predicted stem-loops (see Materials and Methods) are indicated by the open circles.
FIG. 3.
FIG. 3.
Alignment of homologous genuine or putative proteins with the protein products of E. faecalis arcA, arcB, arcR, arcD, argR1, and argR2. Red shading, identity; yellow shading, either identity (letters in red) or conservative replacement (green letters; I≈V≈L≈M≈F, F≈W≈Y, A≈G≈S, S≈T, D≈E, D≈N, E≈Q, N≈Q, K≈R) with respect to the enterococcal sequence. Horizontal arrows and bars under the sequences represent β strands and α helices, respectively. (A) E. faecalis arcA gene product aligned with ADI from P. aeruginosa (P13981). The boxes highlight signature ADI sequences (27). (B) E. faecalis arcB product aligned with catabolic (P08308) and anabolic (P11724) OTCs from P. aeruginosa. The percent identity is indicated after the sequences. CP and ORN denote signature carbamoyl phosphate and ornithine bindingsequences (29). (C) E. faecalis arcR product, aligned with ArcR from B. licheniformis (Y17554). The two helices of the DNA-binding motif and the preceding β strand in the homologous protein Crp are indicated. Two conserved residues that are involved in DNA contacts are indicated with asterisks (28). (D) Alignment of the putative E. faecalis arcD product with ArcD of P. aeruginosa (P18275) and with homologous putative proteins of H. influenzae (P44023) and B. burgdorferi (O51783). Underlining indicates transmembrane helices as annotated in Swissprot for P44023 and P118275, numbered according to these annotations, or, for the other two proteins in the alignment, as predicted by TMpred (see Materials and Methods). (E) Alignment of the putative E. faecalis argR1 and argR2 products with AhrC from B. subtilis (P17893) and ArgR from E. coli (P15282). The basic and acidic domains are indicated, and the secondary structure elements of the winged helix-turn-helix DNA binding domain are shown under the sequence of the E. coli protein (65).
FIG. 4.
FIG. 4.
Arginine induction of the expression of arcA and arcB in E. faecalis (A) and expression in E. coli of plasmid-cloned arcA (B) and arcB (C), monitored by SDS-PAGE of cell extracts. M, protein markers. (A) E. faecalis SD10 was grown to an optical density at 600 nm of 1.4 either in the presence of 50 mM arginine (+) or with arginine replaced by 25 mM glucose (−). The induced bands of 47 and 38 kDa are indicated with a filled and an open arrowhead, respectively. In panels B and C, the left lanes show E. faecalis grown in arginine-containing medium, with indication of the 47- and 38-kDa bands corresponding to the putative arcA and arcB products. Shown in the right two lanes are IPTG-induced (1 mM, 3 h) E. coli BL21 cells transformed as indicated with either the parental pET plasmid having no insert or the pADI (B) or pOTC (C) plasmids carrying the E. faecalis arcA or arcB genes, respectively. The level of ADI or OTC activity of the sonicated E. coli extracts is given below the E. coli lanes.
FIG. 5.
FIG. 5.
Expression at the RNA level of the sequenced genes (A to E), transcription initiation points (F to H), and schematic interpretation of the results (I and J). (A to E) Northern blots of total RNA (10 μg per lane, except in panels B and E, where it was 30 μg) isolated from E. faecalis grown to an optical density at 600 nm of 1.4 in the presence of either 50 mM arginine (A, B, C, and E) or 25 mM glucose and 20 mg of hematin per liter, with aeration (D). Lanes labeled with gene names are autoradiograms hybridized with 32P-labeled probes for the indicated genes, and lanes labeled M or RNA denote methylene blue staining of RNA size markers (sizes indicated on the side) or of total RNA (the 23S and 16SrRNAs are indicated on the side), respectively. The arcB lanes of panel B illustrate the autoradiographic results after short and long film exposition times. (F to H) Extension of 33P-labeled primers complementary to the mRNA for arcA (primer P1), argR1 (primer P2), and argR2 (primer P3). The positions of these primers, relative to the corresponding genes, and of primers P4 to P6, which yielded no discrete extension products, are shown in panel I. Total RNA (11 μg) extracted from arginine-grown, late-exponential-phase cultures was used in the extension reactions. Sequence reactions with the same labeled primers using plasmid pEF-R1 (which carries, as an insert, fragment r; see Fig. 2) as template were performed and subjected to electrophoresis in a sequencing gel next to the corresponding primer extension products. (I) Scheme of the genomic region sequenced with the genes identified, illustrating the correspondence with the observed mRNA products. (J) The region encompassing argR1, argR2, and arcA is expanded to indicate the transcription initiation points and potential control elements.
FIG. 6.
FIG. 6.
Arginine induction of the ADI operon and expression of the pI gene under glucose oxidation conditions. Northern blots with 10 μg of total RNA, either stained with methylene blue (in the panels designated “RNA staining” [the 23S and 16S rRNAs are indicated]) or hybridized with 32P-labeled probes for arcA and pI as indicated, are shown. Cells were grown in 50 ml of medium A supplemented with 25 mM glucose in 50-ml stoppered tubes without an air chamber (no aeration) to an optical density at 600 nm of 0.6 (measured after thorough mixing) and then were centrifuged and resuspended in 50 ml of fresh medium A containing the indicated additions. Except when aeration is indicated, the incubation was continued at 37°C in the same stoppered tubes without an air chamber for the indicated times before cells were centrifuged again and RNA was extracted. When aeration is indicated, the 50-ml culture also contained 0.02 mg of hematin per ml and was placed in a 250-ml Erlenmeyer flask and shaken at 200 rpm.
FIG. 7.
FIG. 7.
Changes in the mRNA levels for the argR2 (left) and argR1 (right) genes with time of incubation in the presence of 25 mM glucose or 50 mM arginine. The graphs depict estimates of the mRNA contents (in arbitrary units) determined by densitometry from Northern blots of 10 μg of total E. faecalis RNA hybridized with the gene-specific 32P-labeled probes (bottom) and normalized versus the amounts of 16 S rRNA in the same lane, also determined by densitometry after methylene blue staining (also shown at the bottom of the figure). Conditions were as described for Fig. 6, without aeration. The time given is that after resuspension of the cells in fresh medium.
FIG. 8.
FIG. 8.
Comparison of the gene composition and organization of the ADI operon in E. faecalis with those of other ADI gene clusters reported for the following microorganisms: L. sake (72), B. licheniformis (36), C. perfringens (48), R. etli (12), P. aeruginosa (33), H. salinarium (53), and O. oeni (67).

References

    1. Abdelal, A. T. 1979. Arginine catabolism by microorganisms. Annu. Rev. Microbiol. 33:139-168. - PubMed
    1. Allen, A. G., and R. N. Perham. 1991. Two lipoyl domains in the dihydrolipoamide acetyltransferase chain of the pyruvate dehydrogenase multienzyme complex of Streptococcus faecalis. FEBS Lett. 287:206-210. - PubMed
    1. Ausubel, F. M., R. Brent, R. E. Kingston, J. G. Seidman, J. A. Smith, and K. Struhl. 2000. Current protocols in molecular biology. John Wiley and Sons, Inc., New York, N.Y.
    1. Baur, H., E. Luethi, V. Stalon, A. Mercenier, and D. Haas. 1989. Sequence analysis and expression of the arginine-deiminase and carbamate-kinase genes of Pseudomonas aeruginosa. Eur. J. Biochem. 179:53-60. - PubMed
    1. Baur, H., V. Stalon, P. Falmagne, E. Luethi, and D. Haas. 1987. Primary and quaternary structure of the catabolic ornithine carbamoyltransferase from Pseudomonas aeruginosa. Eur. J. Biochem. 166:111-117. - PubMed

Publication types

Associated data

LinkOut - more resources