Functional analysis of TraA, the sex pheromone receptor encoded by pPD1, in a promoter region essential for the mating response in Enterococcus faecalis
- PMID: 12399504
- PMCID: PMC151941
- DOI: 10.1128/JB.184.22.6343-6350.2002
Functional analysis of TraA, the sex pheromone receptor encoded by pPD1, in a promoter region essential for the mating response in Enterococcus faecalis
Abstract
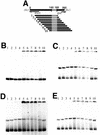
Conjugative transfer of a bacteriocin plasmid, pPD1, of Enterococcus faecalis is induced in response to a peptide sex pheromone, cPD1, secreted from plasmid-free recipient cells. cPD1 is taken up by a pPD1 donor cell and binds to an intracellular receptor, TraA. Once a recipient cell acquires pPD1, it starts to produce an inhibitor of cPD1, termed iPD1, which functions as a TraA antagonist and blocks self-induction in donor cells. In this study, we discuss how TraA transduces the signal of cPD1 to the mating response. Gel mobility shift assays indicated that TraA is bound to a traA-ipd intergenic region, which is essential for cPD1 response. DNase I footprinting analysis suggested the presence of one strong (tab1) and two weak (tab2 and tab3) TraA-binding sites in the intergenic region. Primer extension analysis implied that the transcriptional initiation sites of traA and ipd were located in the intergenic region. Northern analysis showed that cPD1 upregulated and downregulated transcription of ipd and traA, respectively. The circular permutation assay showed that TraA bent a DNA fragment corresponding to the tab1 region, and its angle was changed in the presence of cPD1 or iPD1. From these data, we propose a model that TraA changes the conformation of the tab1 region in response to cPD1 and upregulates the transcription of ipd, which may lead to expression of genes required for the mating response.
Figures


Similar articles
-
Specificity of the TraA-DNA interaction in the regulation of the pPD1-encoded sex pheromone response in Enterococcus faecalis.J Mol Biol. 2008 Jul 25;380(5):932-45. doi: 10.1016/j.jmb.2008.05.058. Epub 2008 May 29. J Mol Biol. 2008. PMID: 18579153
-
Molecular mechanism of peptide-specific pheromone signaling in Enterococcus faecalis: functions of pheromone receptor TraA and pheromone-binding protein TraC encoded by plasmid pPD1.J Bacteriol. 1998 Feb;180(3):449-56. doi: 10.1128/JB.180.3.449-456.1998. J Bacteriol. 1998. PMID: 9457843 Free PMC article.
-
Cloning and characterization of a region of Enterococcus faecalis plasmid pPD1 encoding pheromone inhibitor (ipd), pheromone sensitivity (traC), and pheromone shutdown (traB) genes.J Bacteriol. 1995 Oct;177(19):5567-73. doi: 10.1128/jb.177.19.5567-5573.1995. J Bacteriol. 1995. PMID: 7559344 Free PMC article.
-
Peptide pheromone-induced transfer of plasmid pCF10 in Enterococcus faecalis: probing the genetic and molecular basis for specificity of the pheromone response.Peptides. 2001 Oct;22(10):1529-39. doi: 10.1016/s0196-9781(01)00489-2. Peptides. 2001. PMID: 11587782 Review.
-
The sex pheromone system of Enterococcus faecalis. More than just a plasmid-collection mechanism?Eur J Biochem. 1994 Jun 1;222(2):235-46. doi: 10.1111/j.1432-1033.1994.tb18862.x. Eur J Biochem. 1994. PMID: 8020463 Review.
Cited by
-
An Overview of the Factors Involved in Biofilm Production by the Enterococcus Genus.Int J Mol Sci. 2023 Jul 18;24(14):11577. doi: 10.3390/ijms241411577. Int J Mol Sci. 2023. PMID: 37511337 Free PMC article. Review.
-
Genetics of streptococci, lactococci, and enterococci: review of the sixth international conference.J Bacteriol. 2002 Nov;184(22):6085-92. doi: 10.1128/JB.184.22.6085-6092.2002. J Bacteriol. 2002. PMID: 12399476 Free PMC article. No abstract available.
-
Conjugative plasmid transfer in gram-positive bacteria.Microbiol Mol Biol Rev. 2003 Jun;67(2):277-301, table of contents. doi: 10.1128/MMBR.67.2.277-301.2003. Microbiol Mol Biol Rev. 2003. PMID: 12794193 Free PMC article. Review.
References
-
- Bae, T., and G. M. Dunny. 2001. Dominant-negative mutants of prgX: evidence for a role for PrgX dimerization in negative regulation of pheromone-inducible conjugation. Mol. Microbiol. 39:1307-1320. - PubMed
-
- Bae, T., B. Kozlowicz, and G. M. Dunny. 2002. Two targets in pCF10 DNA for PrgX binding: their role in production of Qa and prgX mRNA and in regulation of pheromone-inducible conjugation. J. Mol. Biol. 315:995-1007. - PubMed
-
- Bastos, M., H. Tomita, K. Tanimoto, and D. B. Clewell. 1998. Regulation of the Enterococcus faecalis pAD1-related sex pheromone response: analyses of traD expression and its role in controlling conjugation functions. Mol. Microbiol. 30:381-392. - PubMed
Publication types
MeSH terms
Substances
LinkOut - more resources
Full Text Sources
Miscellaneous

