. 2002 Oct 25:3:16.
doi: 10.1186/1471-2202-3-16. Epub 2002 Oct 25.

Replicate high-density rat genome oligonucleotide microarrays reveal hundreds of regulated genes in the dorsal root ganglion after peripheral nerve injury

Affiliations

Replicate high-density rat genome oligonucleotide microarrays reveal hundreds of regulated genes in the dorsal root ganglion after peripheral nerve injury

Michael Costigan et al. BMC Neurosci. .

Abstract

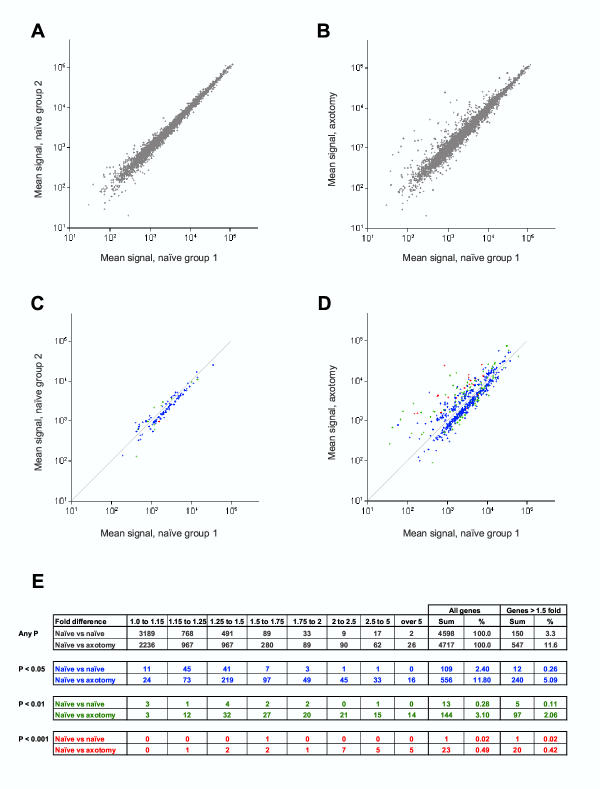
Background: Rat oligonucleotide microarrays were used to detect changes in gene expression in the dorsal root ganglion (DRG) 3 days following sciatic nerve transection (axotomy). Two comparisons were made using two sets of triplicate microarrays, naïve versus naïve and naïve versus axotomy.

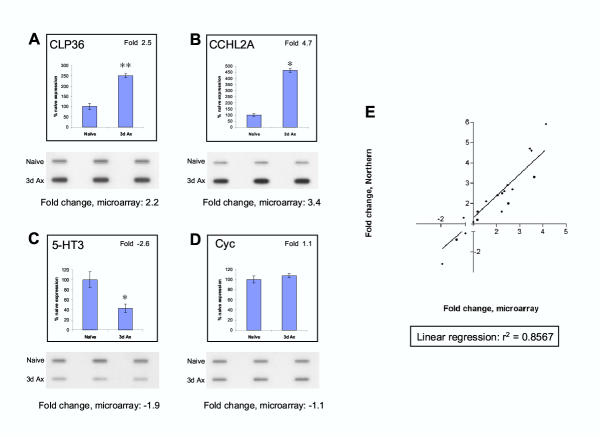
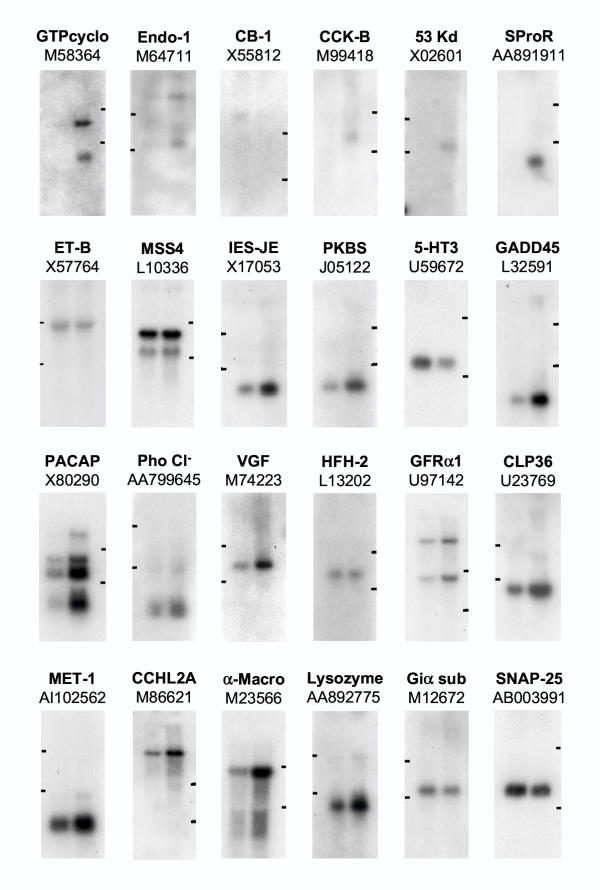
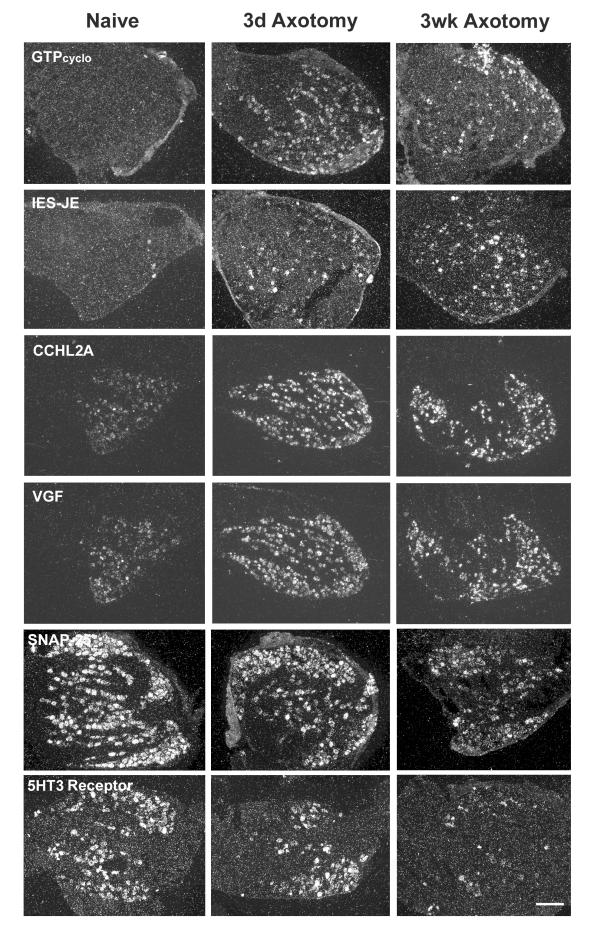
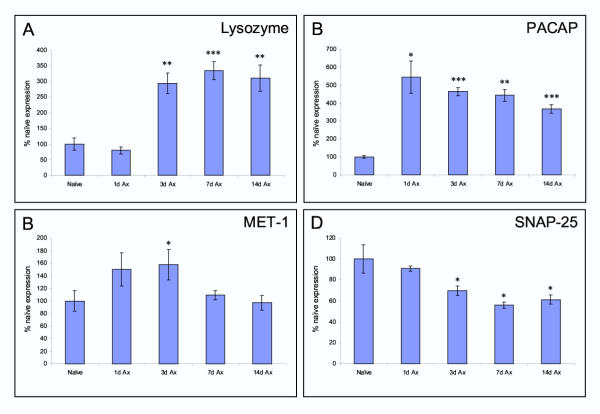
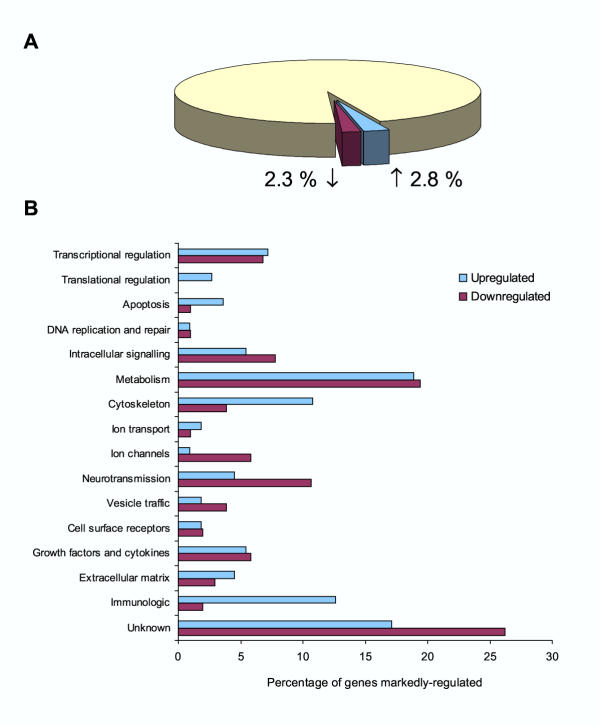
Results: Microarray variability was assessed using the naïve versus naïve comparison. These results support use of a P < 0.05 significance threshold for detecting regulated genes, despite the large number of hypothesis tests required. For the naïve versus axotomy comparison, a 2-fold cut off alone led to an estimated error rate of 16%; combining a >1.5-fold expression change and P < 0.05 significance reduced the estimated error to 5%. The 2-fold cut off identified 178 genes while the combined >1.5-fold and P < 0.05 criteria generated 240 putatively regulated genes, which we have listed. Many of these have not been described as regulated in the DRG by axotomy. Northern blot, quantitative slot blots and in situ hybridization verified the expression of 24 transcripts. These data showed an 83% concordance rate with the arrays; most mismatches represent genes with low expression levels reflecting limits of array sensitivity. A significant correlation was found between actual mRNA differences and relative changes between microarrays (r2 = 0.8567). Temporal patterns of individual genes regulation varied.

Conclusions: We identify parameters for microarray analysis which reduce error while identifying many putatively regulated genes. Functional classification of these genes suggest reorganization of cell structural components, activation of genes expressed by immune and inflammatory cells and down-regulation of genes involved in neurotransmission.


Figures

Figure 1
Figure 1
Intensity plots of average values of all present genes for the naïve group 1 versus naïve group 2. (A) and the naïve group 1 versus the 3 day axotomy group (B). Intensity plots of average values of all genes deemed to vary significantly using an unpaired two-tailed t-test, for the naïve group 1 versus naïve group 2 comparison (C) and the naïve group 1 versus the 3 day axotomy group comparison (D). Plots are color coded so that P < 0.05 (blue points), P < 0.01 (green points), P < 0.001 (red points). Tabulated in (E) are the numbers of genes detected (grey) and those genes achieving P < 0.05 (blue), P < 0.01 (green), P < 0.001 (red) as a function of fold change.
Figure 2
Figure 2
Triplicate Northern slot blots for three genes with altered expression, 2 showing an increase after axotomy (A and B), one a decrease (C). Cyclophilin a gene known not to alter following axotomy shows equal loading of the slot blots and acts as a normalization control (see methods) (D). The histograms indicate the Northern slot blot data expressed as percentage of naïve expression levels or above the graphs as fold change. Below the blots is the gene expression fold change calculated from the triplicate microarray data. ** P < 0.01, * P < 0.05 (two-tailed unpaired t-test). E. Correlation between 19 separate mRNA fold-differences calculated by triplicate slot blot and those calculated from the triplicate arrays. Linear regression line of best fit is also plotted, scale does not represent values between -1 and 1 as fold change values within this range do not exist due to the method of calculation (see methods).
Figure 3
Figure 3
Northern blots showing differences in expression of 24 genes in naïve/control total DRG RNA (left lane) versus 3 day sciatic nerve axotomy total DRG RNA (right lane). Gene descriptions and accession numbers are shown above each blot. The relative positions of 28S and 18S ribosomal RNA are indicated which migrate at 4.7 kb and 1.9 kb respectively. Abbreviations: GTPcyclo GTP cyclohydrolase-1; Endo-1 Endothelin-1; CB-1 Cannabinoid receptor-1; CCK-B Cholecystokinin-B receptor; 53 Kd Stromelysin-1 (matrix metalloproteinase-3); SproR Small proline rich protein-1A; ET-B Endothelin receptor-B; MSS4 Guanine nucleotide releasing protein; IES-JE Monocyte chemoattractant protein-1; PKBS Peripheral benzodiazepine receptor; 5HT3 5HT3A receptor; GADD45 Growth arrest and DNA damage inducible gene alpha; PACAP Pituitary adenylate cyclase activating peptide; Pho Cl- Phospholemman chloride channel; VGF nerve growth factor inducible protein VGF ; HFH-2 HNF-3/fork-head homolog-2; GFRα-1 GDNF receptor alpha-1 subtype; CLP36 PDZ and LIM domain protein-1 (ELFIN); MET-1 Metallothionein-1L; CCHL2A Calcium channel α-2 subunit; α-Macro alpha(2)-macroglobulin; Giα sub Guanine nucleotide-binding protein G-I, α subunit; SNAP-25 Synaptosomal associated protein 25A & B.
Figure 4
Figure 4
Darkfield photomicrographs of 6 μm thick L4 DRG sections processed for in situ hybridization with probes indicated. GTPcyclo, IES-JE, CCHL2A and VGF transcripts show a strong upregulation following injury compared to the naïve. SNAP25, and 5HT3 receptor mRNA show a downregulation following injury to the peripheral neurons. Scale bar = 200 μm.
Figure 5
Figure 5
Axotomy induced changes in expression of Lysozyme, PACAP, MET-1 and SNAP25 transcript levels over time. The histograms indicate the triplicate Northern slot blot data expressed as percentage of naïve expression levels 1, 3, 7 and 14 days post axotomy. ***P < 0.001 ** P < 0.01, * P < 0.05 (two-tailed unpaired t-test).
Figure 6
Figure 6
Percentage of detected genes regulated above 1.5-fold (P < 0.05) with the proportion up and down regulated also shown (A). Genes regulated above 1.5-fold (P < 0.05) were classified into functional classes, plotted are the percent of up and down regulated genes respectively in each functional class (B).

References

    1. Devor M, Seltzer Z. Pathophysiology of damaged nerves in realtion to chronic pain. In: Wall PD, Melzack R, editor. In Textbook of Pain. Edinburgh: Churchill Livingstone; 1999. pp. 129–164.
    1. Kerr BJ, Thompson SW, Wynick D, McMahon SB. Endogenous galanin is required for the full expression of central sensitization following peripheral nerve injury. Neuroreport. 2001;12:3331–3334. doi: 10.1097/00001756-200110290-00037. - DOI - PubMed
    1. Hokfelt T, Zhang X, Wiesenfeld-Hallin Z. Messenger plasticity in primary sensory neurons following axotomy and its functional implications. TINS. 1994;17:22–30. doi: 10.1016/0166-2236(94)90031-0. - DOI - PubMed
    1. Woolf CJ, Mannion RJ. Neuropathic pain: aetiology, symptoms, mechanisms, and management. Lancet. 1999;353:1959–1964. doi: 10.1016/S0140-6736(99)01307-0. - DOI - PubMed
    1. Wisden W, Gundlach AL, Barnard EA, Seeburg PH, Hunt SP. Distribution of GABAA receptor subunit mRNAs in rat lumbar spinal cord. Brain Res Mol Brain Res. 1991;10:179–183. doi: 10.1016/0169-328X(91)90109-B. - DOI - PubMed

Publication types

MeSH terms