. 2002 Oct 28;159(2):225-36.
doi: 10.1083/jcb.200207046. Epub 2002 Oct 28.

Visualization of replication initiation and elongation in Drosophila

Affiliations

Visualization of replication initiation and elongation in Drosophila

Julie M Claycomb et al. J Cell Biol. .

Abstract

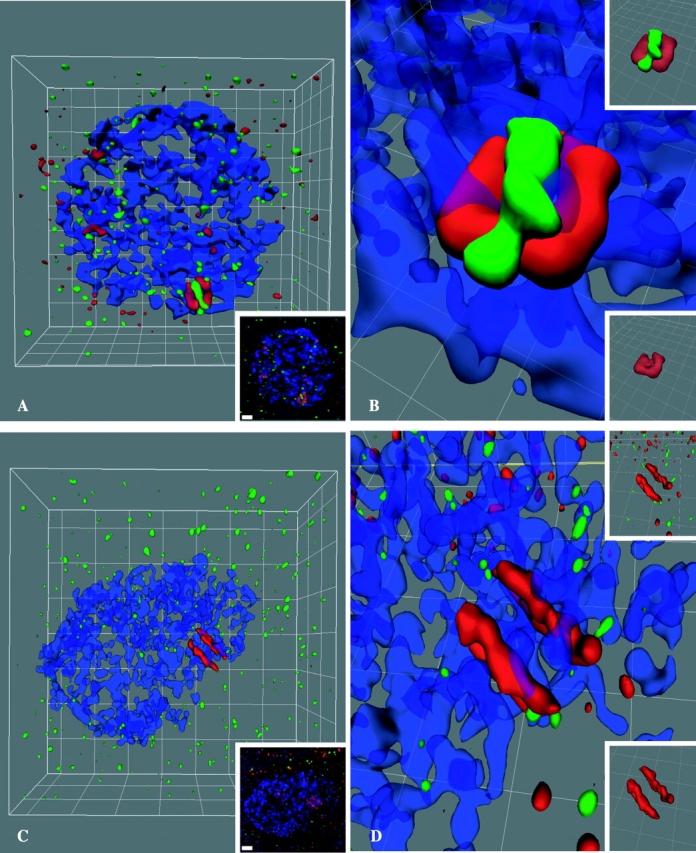
Chorion gene amplification in the ovaries of Drosophila melanogaster is a powerful system for the study of metazoan DNA replication in vivo. Using a combination of high-resolution confocal and deconvolution microscopy and quantitative realtime PCR, we found that initiation and elongation occur during separate developmental stages, thus permitting analysis of these two phases of replication in vivo. Bromodeoxyuridine, origin recognition complex, and the elongation factors minichromosome maintenance proteins (MCM)2-7 and proliferating cell nuclear antigen were precisely localized, and the DNA copy number along the third chromosome chorion amplicon was quantified during multiple developmental stages. These studies revealed that initiation takes place during stages 10B and 11 of egg chamber development, whereas only elongation of existing replication forks occurs during egg chamber stages 12 and 13. The ability to distinguish initiation from elongation makes this an outstanding model to decipher the roles of various replication factors during metazoan DNA replication. We utilized this system to demonstrate that the pre-replication complex component, double-parked protein/cell division cycle 10-dependent transcript 1, is not only necessary for proper MCM2-7 localization, but, unexpectedly, is present during elongation.


Figures

Figure 1.
Figure 1.
ORC2 is present at chorion origins during amplification initiation but is lost from origins as initiation ends. (A and B) Deconvolution microscopy and volume rendering shows that in stage 10B follicle cell nuclei, ORC2 (green) partially colocalizes with BrdU (red) at the third chromosome chorion cluster. DNA is in blue (TOTO). BrdU foci without ORC2 localized correspond to uncharacterized sites of amplification throughout the genome, and the focus next to the third chromosome amplicon is likely the X cluster. (A, inset) Immunofluorescence image from which A and B were created. (B, inset) Close-up view of BrdU and ORC2 without DNA (top), and a close-up view of BrdU only (bottom; Video 1, available at http://www.jcb.org/cgi/content/full/jcb.200207046/DC). (C–E) Confocal microscopy shows that in stage 10B follicle cell nuclei, ORC2 (green) colocalizes with FISH signal from a 3.8 kb third chromosome chorion probe (red) that spans ACE3 and oriβ. (E) Shows the merged image; all images are in a single plane. (F and G) In stage 11 follicle cell nuclei, ORC2 (green) remains localized to origin regions of the third chromosome chorion locus, whereas BrdU (red) signal begins to resolve into bars as forks move outward. DNA is in blue (TOTO). (F, inset) Immuno- fluorescence image from which the images in F and G were created. (G, inset) Close-up view of BrdU and ORC2, without DNA (top), and a close-up view of BrdU only (bottom). (H) The onionskin/reinitiation model of chorion amplification representing the localization of ORC2 (olive) and incorporation of BrdU (salmon) in stage 10B and 11 follicle cells as initiation and limited elongation occur. (I) The onionskin/reinitiation model representing amplification by stages 12 and 13, when ORC2 is no longer localized and no further initiation events occur. Only existing replication forks move out and BrdU (salmon) incorporated at these replication forks is seen as double bars. The dimensions used for deconvolution measurements are shown in (I). Bars, 1 μm; grid boxes, 1 μm2.
Figure 2.
Figure 2.
Quantitative realtime PCR performed on staged egg chamber DNA confirms the timing of initiation and elongation. DNA from egg chambers before chorion amplification, stages 1–8, and during amplification, stages 10B, 11, 12, and 13 was used in quantitative realtime PCR reactions. Primer sets used for chorion loci spanned the third chromosome 50 kb on either side of ACE3 (denoted as 0 distance), in 5-kb intervals, and control primer sets (nonamplified) were to an intergenic region on chromosome arm 3R. The Y axis represents fold amplification, measured as the ratio of the chorion locus to the 3R locus and errors are the standard deviation of the sample. The X axis represents distance along the chorion locus in kilobases, with the major origin, oriβ located between 0 and 5 kb. (A) In stage 1–8 egg chambers, no chorion amplification has occurred and the ratio of chorion to control loci is centered at ∼1. Note that the scale in A is different from the scale in B–F. (B) By stage 10B, chorion gene amplification has initiated and there is an increase in fold amplification over ∼35 kb total. (C) By stage 11, additional initiation has occurred at the origins, as fold amplification increases to ∼30. (D) During stage 12, no further increases in copy number are detected at origins, but an increase in fold amplification both proximal and distal to origins is detected. (E) By stage 13, replication forks have progressed out further, as an increase in fold amplification is detected out to ∼35 and –40 kb. No further initiation events occurred. The stage 13 reactions were performed on two separate samples of stage 13 DNA and similar results were observed in both trials (unpublished results). (F) A composite graph of A–E showing fold amplification at the third chromosome chorion locus throughout egg chamber development.
Figure 3.
Figure 3.
PCNA and MCM2–7 staining patterns coincide with BrdU incorporation throughout amplification. (A–C and D–F) PCNA is in red, BrdU is in green. (A–C) Several stage 10B follicle cell nuclei, in which initiation of amplification is coupled with elongation. In such nuclei, PCNA is present and colocalizes with BrdU incorporation at the X and the third chromosome chorion loci. The third chromosome is the larger of the foci (Calvi et al., 1998), and the X chromosome cluster (arrow) has already resolved into the double bar structure by this stage. In addition to being at the chorion loci, PCNA is diffusely present throughout the nucleus during this stage. (D–F) A single follicle cell nucleus from a stage 13 egg chamber shows this pattern of PCNA and BrdU staining, which is characteristic of replication fork movement. The 2 smaller foci of staining in this image may be the X chromosome amplicon. (G–I and J–L) MCM2–7 are in red and PCNA is in green. (G–I) MCM2–7 and PCNA colocalize in stage 11 follicle cell nuclei (arrows represent third chromosome clusters in two nuclei). (J–L) MCM2–7 staining, like PCNA, persists throughout chorion amplification and resolves into the double bar structure by stage 12. One stage 12 nucleus is shown. Bars, 1 μm.
Figure 4.
Figure 4.
DUP/Cdt1 colocalizes with BrdU throughout chorion amplification. (A–C and D–F) DUP is in red and BrdU is in green. (A–C) In a stage 10B egg chamber, DUP colocalizes at sites of chorion amplification with BrdU. Two follicle cell nuclei are shown. (D–F) The DUP staining pattern colocalizes with that of BrdU throughout subsequent stages of chorion amplification and resolves into the double bar structure by stage 13, as seen in this follicle cell nucleus. Bars, 1 μm.
Figure 5.
Figure 5.
The pattern of DUP and ORC2 localization indicates that DUP travels with replication forks. (A and B) Deconvolution microscopy and volume rendering of a stage 10B follicle cell nucleus shows that the patterns of DUP/Cdt1 (red) and ORC2 (green) slightly overlap at origins. DNA is in blue (TOTO). The relative amount of DUP/Cdt1 at the origins is less than the amount of DUP/Cdt1 in regions corresponding to fronts of replication fork movement. (A, inset) Fluorescence image from which A and B were developed. (B, inset) Close-up of DUP/Cdt1 and ORC2 without the DNA (top), and a close-up view of DUP/Cdt1 alone (bottom; Video 2, available at http://www.jcb.org/cgi/content/full/jcb.200207046/DC). (C and D) By stage 13, deconvolution microscopy and volume rendering shows that ORC2 (green) has been lost from origins, whereas DUP/Cdt1 (red) persists and resolves into the double bar structure. (C, inset) Fluorescence image used to make (C and D) and the insets in (D) show a close-up view of the DUP/Cdt1 double bars in relation to ORC2 signal (top) and DUP/Cdt1 only (bottom). Bars, 1 μm; grid boxes, 1 μm2.
Figure 6.
Figure 6.
MCM2–7 localization to chorion loci is disrupted in dup PA7 7/dupPA77mutants. (A–D) MCM2–7 are in red and lamin is in green. (A and C) In wild-type follicle cells, MCM2–7 localize to chorion foci throughout the process of chorion amplification. (B and D) In contrast, in the dup female-sterile mutant, localization of MCM2–7 to chorion loci is not observed during any stage of amplification, and MCM2–7 cluster at the nuclear envelope. (B and D) MCM2–7 and lamin staining are shown separately to the right. At this level of resolution it is impossible distinguish whether MCM2–7 are trapped inside or outside of the nucleus. All images were captured at the same exposure for comparison. Bars, 1 μm.

Similar articles

Cited by

References

    1. Aparicio, O.M., D.M. Weinstein, and S.P. Bell. 1997. Components and dynamics of DNA replication complexes in S. cerevisiae: redistribution of MCM proteins and Cdc45p during S phase. Cell. 91:59–69. - PubMed
    1. Aparicio, O.M., A.M. Stout, and S.P. Bell. 1999. Differential assembly of Cdc45p and DNA polymerases at early and late origins of DNA replication. Proc. Natl. Acad. Sci. USA. 96:9130–9135. - PMC - PubMed
    1. Asano, M., and R.P. Wharton. 1999. E2F mediates developmental and cell cycle regulation of ORC1 in Drosophila. EMBO J. 18:2435–2448. - PMC - PubMed
    1. Ashburner, M. 1989. Drosophila: A Laboratory Manual. Cold Spring Harbor Laboratory Press, Cold Spring Harbor, NY. 434 pp.
    1. Austin, R.J., T.L. Orr-Weaver, and S.P. Bell. 1999. Drosophila ORC specifically binds to ACE3, an origin of DNA replication control element. Genes Dev. 13:2639–2649. - PMC - PubMed

Publication types

MeSH terms