. 2002 Dec;71(6):1273-84.
doi: 10.1086/344513. Epub 2002 Oct 28.

Structural analysis of insulin minisatellite alleles reveals unusually large differences in diversity between Africans and non-Africans

Affiliations

Structural analysis of insulin minisatellite alleles reveals unusually large differences in diversity between Africans and non-Africans

John D H Stead et al. Am J Hum Genet. 2002 Dec.

Abstract

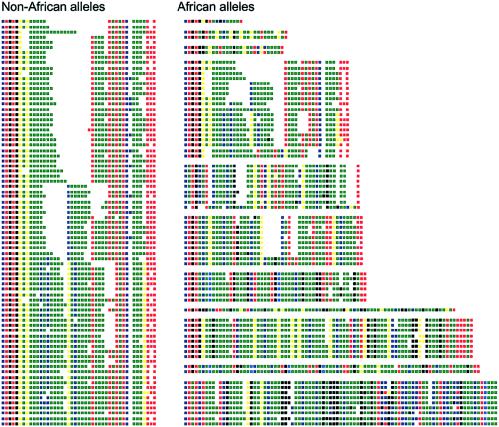
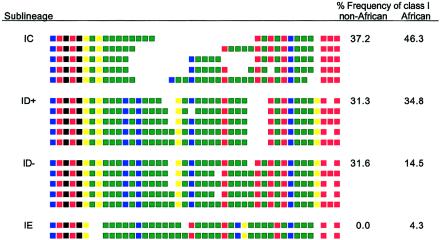
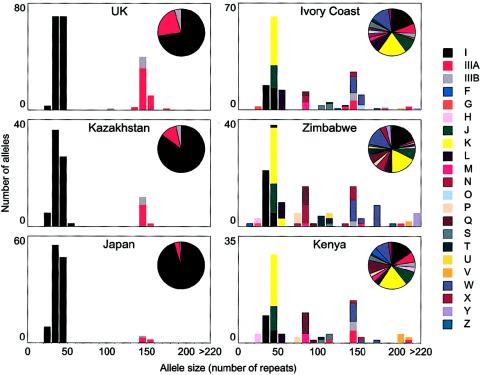
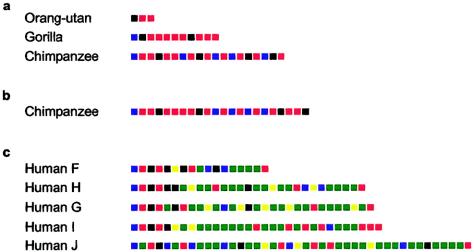
The insulin minisatellite (INS VNTR) associates with susceptibility to a variety of diseases. We have developed a high-resolution system for analyzing variant repeat distributions applicable to all known minisatellite alleles, irrespective of size, which allows lineages of related alleles to be identified. This system has previously revealed extremely low structural diversity in the minisatellite among northern Europeans from the United Kingdom, with all alleles belonging to one of only three highly diverged lineages called "I," "IIIA," and "IIIB." To explore the origins of this remarkably limited lineage diversity, we have characterized an additional 780 alleles from three non-African and three African populations. In total, 22 highly diverged lineages were identified, with structural intermediates absent from extant populations, suggesting a bottleneck within the ancestry of all humans. The difference between levels of diversity in Africans and non-Africans is unusually large, with all 22 lineages identified in Africa compared with only three lineages seen not only in the United Kingdom but also in the other non-African populations. We also find evidence for overrepresentation of lineage I chromosomes in non-Africans. These data are consistent with a common out-of-Africa origin and an unusually tight bottleneck within the ancestry of all non-African populations, possibly combined with differential and positive selection for lineage I alleles in non-Africans. The important implications of these data for future disease-association studies are discussed.


Figures

Figure  1
Figure 1
Allele structures at the INS VNTR. Selected examples of allele codes defined by MVR-PCR analysis are presented in 5′-to-3′ orientation, with the INS gene to the right. Although alleles as long as 630 repeats have been analyzed, for convenience only alleles shorter than 90 repeats are shown. All of these non-African alleles are from a single lineage, whereas there are 11 lineages (arranged in groups) in Africans within this size range. Each square represents a single repeat unit, with different colors representing different variant repeats as follows: green = A, red = B, dark blue = C, pale blue = E, yellow = F, and pink = H. Some repeats (blackened squares) were not amplifiable, because of the presence of additional unknown sequence variants. Gaps were introduced by hand to facilitate allele alignments. All allele codes are available at the authors' Web site.
Figure  2
Figure 2
Sublineages within lineage I. Alleles from each sublineage of lineage I are presented, as described in figure 1. The relative frequencies of each sublineage within lineage I are shown for the combined non-African populations (323 lineage I chromosomes) and the combined African populations (69 lineage I chromosomes). Lineage I alleles in Africans can be divided by MVR code into three sublineages, IC, ID, and IE, with ID alleles further dividing into sublineages ID+ and ID− (Stead et al. 2000). Each sublineage is distinguished by variation, both at the minisatellite and in the flanking haplotype (authors' unpublished data).
Figure  3
Figure 3
Lineage size and frequency distributions. Relative frequencies and size distribution of the 22 lineages defined by MVR-PCR are presented for each of the six populations analyzed.
Figure  4
Figure 4
Relationship between lineage size and estimated mutation rate. Mutation rates were estimated from the combined African data by use of Ewens's distribution (Ewens 1972) for lineages that each contained at least five alleles and at least one instance of duplicate examples of the same allele. Lineages IIIA (∼150 repeats) and Y (∼450 repeats) were thus excluded. The positive correlation between estimated mutation rate and allele size is significant (r=0.77, P<.001).
Figure  5
Figure 5
The INS VNTR in primates. A, MVR-PCR–typed alleles from one chimpanzee, one gorilla, and one orangutan (as in fig. 1). B, A single chimpanzee allele characterized elsewhere, using sequencing (Seino et al. 1992), with the sequence converted in silico into a “pseudo-MVR” code. The 3′ terminal repeat is a null repeat undetectable by the PCR primers used in MVR-PCR; such terminal null repeats could exist in other great ape alleles. C, Alleles from the five human lineages containing the shortest alleles.

References

Electronic-Database Information

    1. Variant Repeat Mapping at the Insulin Minisatellite, http://www.leicester.ac.uk/genetics/ajj/insulin/
    1. Online Mendelian Inheritance in Man (OMIM), http://www.ncbi.nlm.nih.gov/Omim/ (for INS VNTR [MIM 125852])

References

    1. Alonso S, Armour JA (2001) A highly variable segment of human subterminal 16p reveals a history of population growth for modern humans outside Africa. Proc Natl Acad Sci USA 98:864–869 - PMC - PubMed
    1. Armour JA, Anttinen T, May CA, Vega EE, Sajantila A, Kidd JR, Kidd KK, Bertranpetit J, Paabo S, Jeffreys AJ (1996) Minisatellite diversity supports a recent African origin for modern humans. Nat Genet 13:154–160 - PubMed
    1. Barbujani G, Magagni A, Minch E, Cavalli-Sforza LL (1997) An apportionment of human DNA diversity. Proc Natl Acad Sci USA 94:4516–4519 - PMC - PubMed
    1. Bell GI, Karam JH, Rutter WJ (1981) Polymorphic DNA region adjacent to the 5′ end of the human insulin gene. Proc Natl Acad Sci USA 78:5759–5763 - PMC - PubMed
    1. Bennett ST, Lucassen AM, Gough SC, Powell EE, Undlien DE, Pritchard LE, Merriman ME, Kawaguchi Y, Dronsfield MJ, Pociot F, Nerup J, Bouzekri N, Cambon-Thomsen A, Ronningen KS, Barnett AH, Bain SC, Todd JA (1995) Susceptibility to human type 1 diabetes at IDDM2 is determined by tandem repeat variation at the insulin gene minisatellite locus. Nat Genet 9:284–292 - PubMed

Publication types

Associated data