Comparative Study
. 2002 Oct;16(8):1531-40.
doi: 10.1046/j.1460-9568.2002.02224.x.

Differential induction and localization of mPer1 and mPer2 during advancing and delaying phase shifts

Affiliations
Comparative Study

Differential induction and localization of mPer1 and mPer2 during advancing and delaying phase shifts

Lily Yan et al. Eur J Neurosci. 2002 Oct.

Abstract

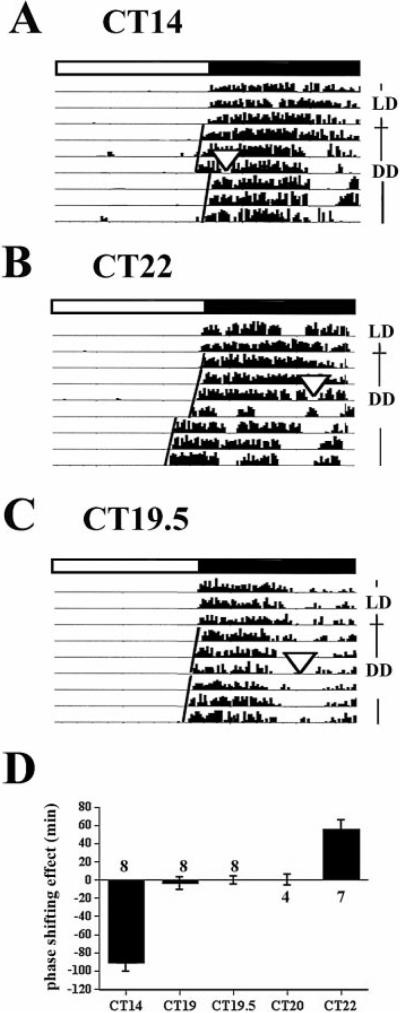
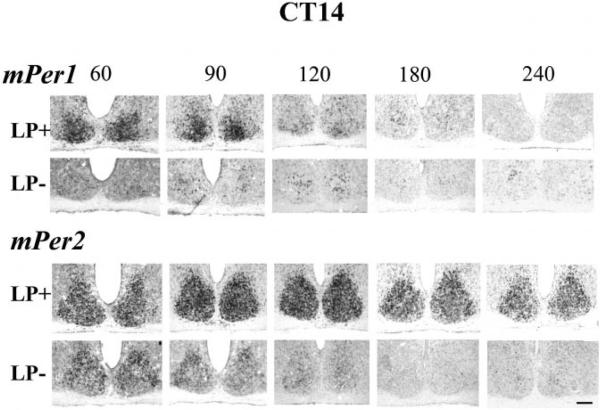
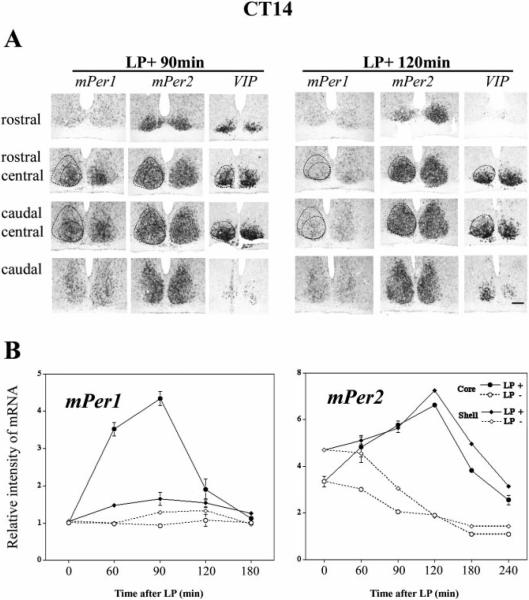
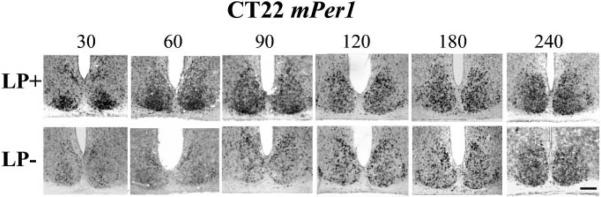
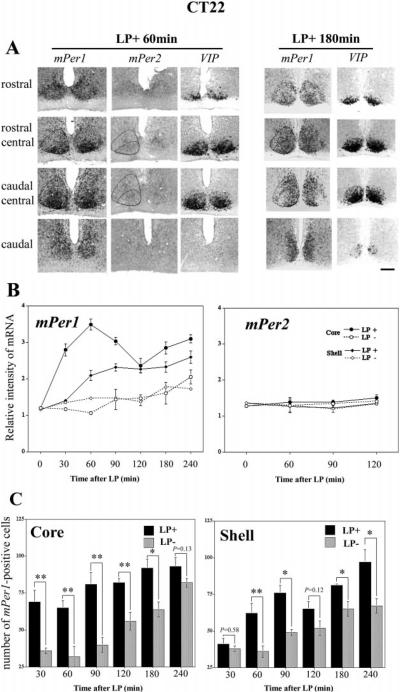
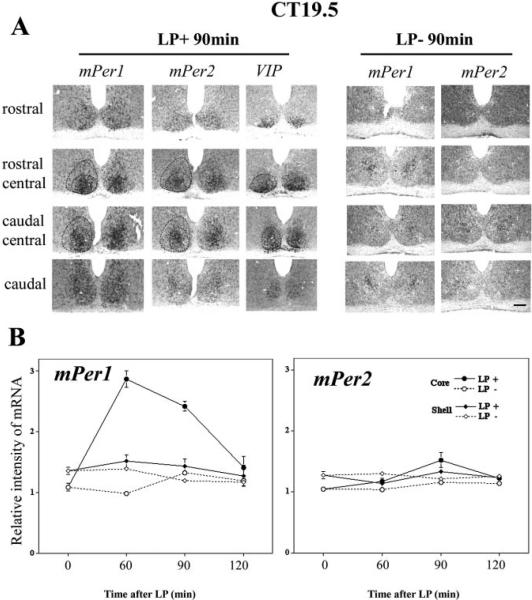
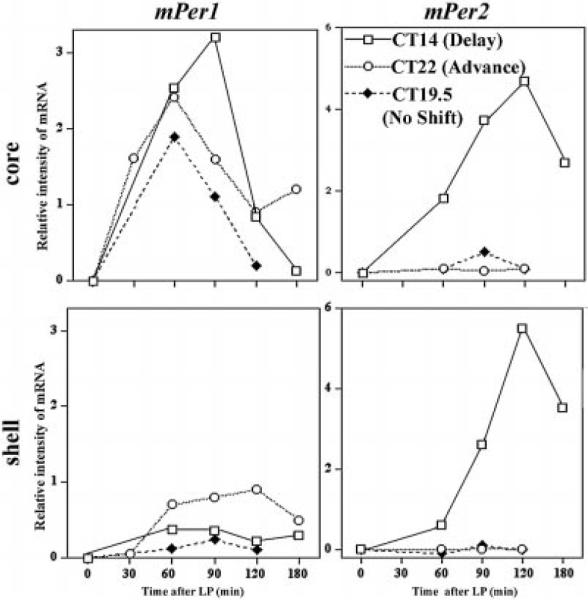
The mechanism whereby brief light exposure resets the mammalian circadian clock in a phase dependent manner is not known, but is thought to involve Per gene expression. At the behavioural level, a light pulse produces phase delays in early subjective night, phase advances in late subjective night, and no phase shifts in mid-subjective night or subjective day. To understand the relationship between Per gene activity and behavioural phase shifts, we examined light-induced mPer1 and mPer2 expression in the suprachiasmatic nucleus (SCN) of the mouse, in the subjective night, with a view to understanding SCN heterogeneity. In the VIP-containing region of the SCN (termed 'core'), light-induced mPer1 expression occurs at all times of the subjective night, while mPer2 induction is seen only in early subjective night. In the remaining regions of the SCN (termed 'shell'), a phase delaying light pulse produces no mPer1 but significant mPer2 expression, while a phase advancing light pulse produces no mPer2 but substantial mPer1 induction. Moreover, following a light pulse during mid-subjective night, neither mPer1 nor mPer2 are induced in the shell. The results reveal that behavioural phase shifts occur only when light-induced Per gene expression spreads from the core to the shell SCN, with mPer1 expression in shell corresponding to phase advances, and mPer2 corresponding to phase delays. The results indicate that the time course and the localization of light-induced Per gene expression in SCN reveals important aspects of intra-SCN communication.


Figures

Fig. 1
Fig. 1
Actograms showing phase shifts of wheel-running activity after a light pulse (900 lux, 30 min) during subjective night. Mice maintained in a 12-h LD cycle (indicated by the white-black bar on the top) were placed in constant darkness (DD) as indicated by the label to the right of each figure. Light pulses were given on the third day in DD. The magnitude of the phase shifts was calculated by comparing eye-fitted lines drawn according to the onset of the circadian behaviour before and after the light pulses. (A) A light pulse at CT14 results in phase delay of circadian rhythm; (B) a light pulse at CT22 results in phase advance of circadian rhythm; (C) a light pulse at CT19.5 reduces no-phase shift; (D), Mean ± SEM of the phase shifting effects of light at CT14, 19, 19.5, 20 and 22. Numbers above or under bars denote sample sizes for each condition. ▽ Indicates the light pulse.
Fig. 2
Fig. 2
Light-induced mPer1 and mPer2 expression in the SCN after a light pulse at CT14 as shown by in situ hybridization. Animals were given a light pulse (900 lux, 30 min) at CT14, then killed at the following the time points: 60, 90, 120, 180 and 240 min after the beginning of the light pulse. Control animals that were not exposed to the light were killed on the same schedule. Every third SCN section from each animal was processed with mPer1, mPer2 and VIP in situ probes. mPer1 LP+ (row 1) and mPer2 LP+ (row 3) are shown in adjacent sections. mPer1 LP− (row 2) and mPer2 LP− (row 4) are also adjacent sections. LP, light pulse; the numbers across the top indicate time in minutes after the beginning of the light pulse. Scale bar = 100 μm.
Fig. 3
Fig. 3
Topographic and quantitative analysis of light-induced mPer1 and mPer2 in the SCN after a light pulse (900 lux, 30 min) at CT14. (A), mPer1, mPer2 and VIP expression in adjacent sections from rostral to caudal SCN are shown in two representative animals from the LP+ 90-min and LP+ 120-min groups. VIP was used as the marker for the core SCN, and light-induced mPer2 staining was used to delineate the border of the SCN. Quantitative analysis was done in the core region (VIP-containing cells region) and shell region (no VIP-containing SCN region) independently.(B), Quantitative analysis was for the relative intensity of mPer1 (left) and mPer2 (right) in core and shell SCN with (LP+) or without (LP−) the light pulse. For mPer1, the mean effect of light pulse is significant in the core region (two-way anova, P < 0.0001), but not in the shell region (P > 0.05). For mPer2, the mean effect of light-pulse is significant in both the core and the shell region (P < 0.0001). The data are presented as Mean ± SEM. Scale bar = 100 μm.
Fig. 4
Fig. 4
Light-induced mPer1 expression in the SCN after a light pulse (900 lux, 30 min) at CT22 as shown by in situ hybridization. Animals were given a light pulse at CT22, then killed as described in Fig. 2. Control animals that were not exposed to the light pulse were killed on the same schedule. Quantification of the results is shown in Fig. 5. LP, light pulse; the numbers along the top indicate time in minutes after the beginning of the light pulse. Scale bar = 100 μm.
Fig. 5
Fig. 5
Topographic and quantitative analysis of light-induced mPer1 in the SCN after a light pulse (900 lux, 30 min) at CT22. (A), mPer1, mPer2 and VIP staining in adjacent sections from rostral to caudal SCN are shown two representative animals from the LP+ 60-min and LP+ 180-min groups. VIP was used as a marker of the core SCN, and mPer1 staining was used to delineate the border of the SCN. Quantitative analysis was done in the core region (VIP-containing cells region) and shell region (no VIP-containing SCN region) independently. (B), The relative intensity of mPer1 (left) and mPer2 (right) in core and shell SCN with (LP+) or without (LP−) the light pulse. For mPer1, the effect of light pulse is significant in both the core and the shell SCN (P < 0.0001). While for mPer2, there is no significant effect of light pulse in either the core or the shell SCN (P > 0.05). (C), Number of mPer1-positive cells in core (left) and shell (right) at each time point following the light pulse. *P < 0.05, **P < 0.01, student t-test. The data are presented as Mean ± SEM. Scale bar = 100 μm.
Fig. 6
Fig. 6
Topographic and quantitative analysis of light-induced mPer1 and mPer2 in the SCN after a light pulse (900 lux, 30 min) at CT19.5. (A), 90 min after the beginning of the light pulse (LP+ 90 min), mPer1, mPer2 and VIP staining in adjacent sections from rostral to caudal SCN, compared with the no light pulse control (LP− 90 min). (B), Relative intensity of mPer1 and mPer2 in core and shell SCN with (LP+) or without (LP−) the light pulse. For mPer1, the mean effect of light pulse is significant in the core region (P < 0.0001), but not in the shell region (P > 0.05). While for mPer2, there is a small, but significant increase in the core SCN (P < 0.05), which was confirmed at 90 min (t-test, P < 0.05), and not significant increase in the shell region (P > 0.05). The data are presented as Mean ± SEM. Scale bar = 100 μm.
Fig. 7
Fig. 7
Summary of light-induced mPer1 and mPer2 in core and shell SCN, respectively. Solid line and open squares show the result of a phase delaying pulse at CT14, dotted line and open circles show the result of a phase advancing light pulse at CT22, and dashed line and solid diamonds show the results of a nonphase shifting light pulse at CT19.5. The data are presented as the difference between the Mean of LP+ and LP− at each distinct condition.

References

    1. Abrahamson EE, Moore RY. Suprachiasmatic nucleus in the mouse: retinal innervation, intrinsic organization and efferent projections. Brain Res. 2001;916:172–191. - PubMed
    1. Aida R, Moriya T, Araki M, Akiyama M, Wada K, Wada E, Shibata S. Gastrin-releasing peptide mediates photic entrainable signals to dorsal subsets of suprachiasmatic nucleus via induction of period gene in mice. Mol. Pharmacol. 2002;61:26–34. - PubMed
    1. Akiyama M, Kouzu Y, Takahashi S, Wakamatsu H, Moriya T, Maetani M, Watanabe S, Tei H, Sakaki Y, Shibata S. Inhibition of light- or glutamate-induced mPer1 expression represses the phase shifts into the mouse circadian locomotor and suprachiasmatic firing rhythms. J. Neurosci. 1999;19:1115–1121. - PMC - PubMed
    1. Albrecht U, Sun ZS, Eichele G, Lee CC. A differential response of two putative mammalian circadian regulators, mPer1 and mPer2, to light. Cell. 1997;91:1055–1064. - PubMed
    1. Albrecht U, Zheng B, Larkin D, Sun ZS, Lee CC. mPer1 and mPer2 are essential for normal resetting of the circadian clock. J. Biol. Rhythms. 2001;16:100–104. - PubMed

Publication types