. 2002 Nov;68(11):5394-407.
doi: 10.1128/AEM.68.11.5394-5407.2002.

Characterization of the rRNA locus of Pfiesteria piscicida and development of standard and quantitative PCR-based detection assays targeted to the nontranscribed spacer

Affiliations

Characterization of the rRNA locus of Pfiesteria piscicida and development of standard and quantitative PCR-based detection assays targeted to the nontranscribed spacer

Keiko Saito et al. Appl Environ Microbiol. 2002 Nov.

Abstract

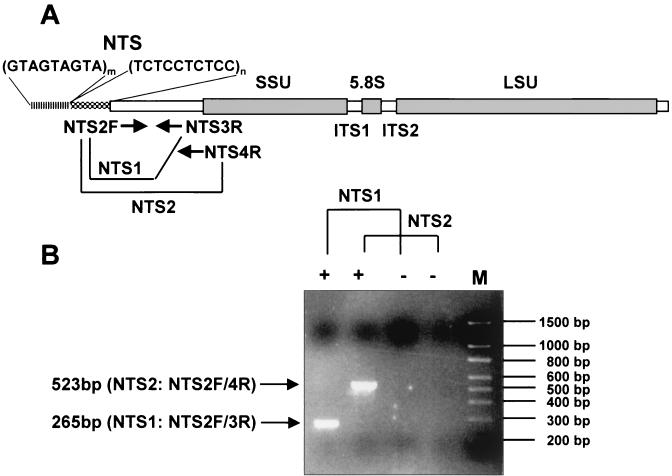
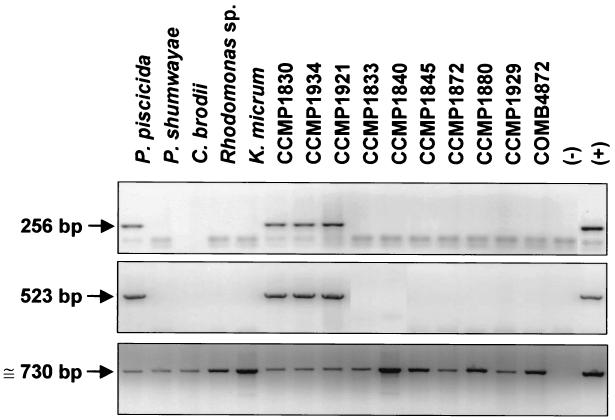
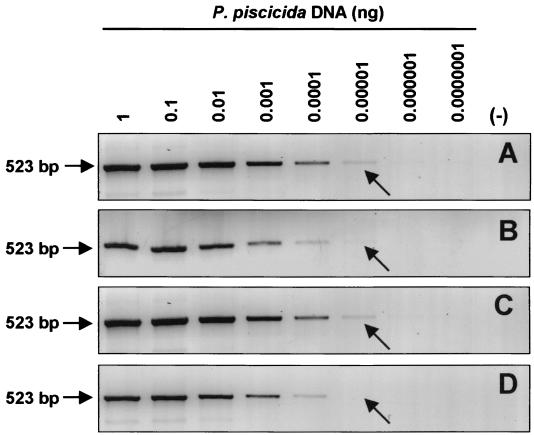
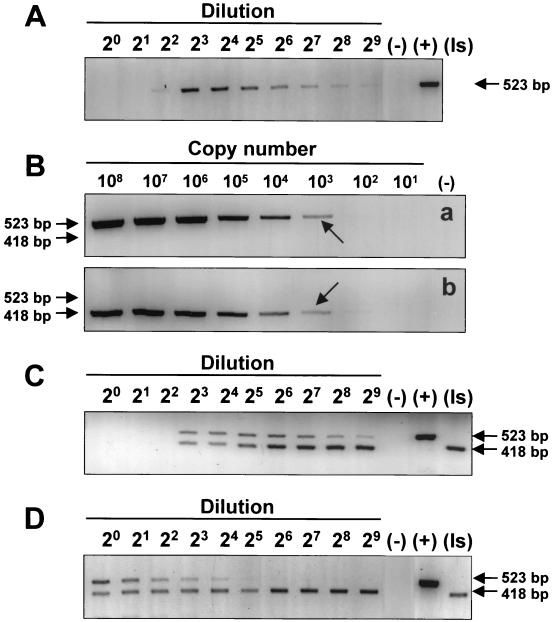
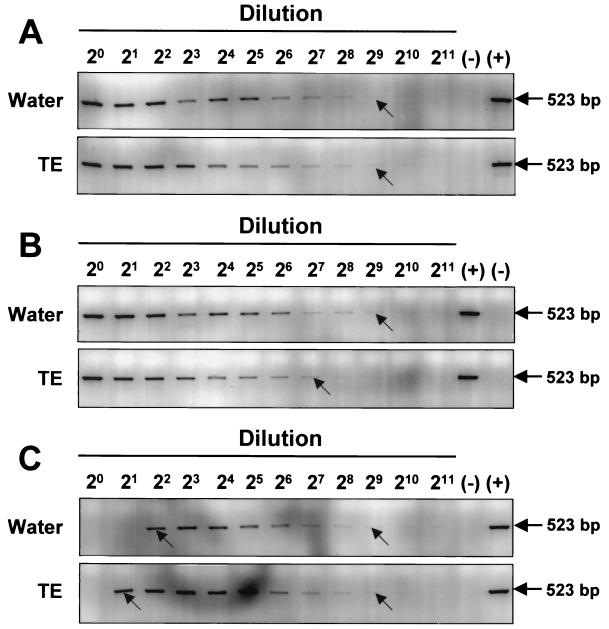
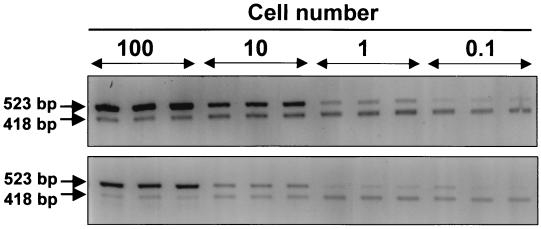
Pfiesteria piscicida is a heterotrophic dinoflagellate widely distributed along the middle Atlantic shore of the United States and associated with fish kills in the Neuse River (North Carolina) and the Chesapeake Bay (Maryland and Virginia). We constructed a genomic DNA library from clonally cultured P. piscicida and characterized the nontranscribed spacer (NTS), small subunit, internal transcribed spacer 1 (ITS1), 5.8S region, ITS2, and large subunit of the rRNA gene cluster. Based on the P. piscicida ribosomal DNA sequence, we developed a PCR-based detection assay that targets the NTS. The assay specificity was assessed by testing clonal P. piscicida and Pfiesteria shumwayae, 35 additional dinoflagellate species, and algal prey (Rhodomonas sp.). Only P. piscicida and nine presumptive P. piscicida isolates tested positive. All PCR-positive products yielded identical sequences for P. piscicida, suggesting that the PCR-based assay is species specific. The assay can detect a single P. piscicida zoospore in 1 ml of water, 10 resting cysts in 1 g of sediment, or 10 fg of P. piscicida DNA in 1 micro g of heterologous DNA. An internal standard for the PCR assay was constructed to identify potential false-negative results in testing of environmental sediment and water samples and as a competitor for the development of a quantitative competitive PCR assay format. The specificities of both qualitative and quantitative PCR assay formats were validated with >200 environmental samples, and the assays provide simple, rapid, and accurate methods for the assessment of P. piscicida in water and sediments.


Figures

FIG. 1.
FIG. 1.
Organization of P. piscicida rDNA and locations of primers for P. piscicida diagnostic PCR (A) and amplification of target DNA (B). One forward primer (NTS2F) and two reverse primers (NTS3R and NTS4R) amplify 265- (NTS2F-NTS3R) and 523-bp (NTS2F-NTS4R) amplicons localized on the NTS of rDNA. +, positive control; −, negative control; M, 100-bp ladder molecular size markers. The arrows indicate target amplicons separated by electrophoresis at 100 V for 1 h on 1.5% agarose gels stained by EtBr. Ten microliters of a 20-μl PCR mixture was applied per well.
FIG. 2.
FIG. 2.
Species specificity of PCR-based assay for P. piscicida. DNAs of dinoflagellate isolates were amplified with specific primers for P. piscicida and actin genes. (Top) NTS1 PCR for P. piscicida with NTS2F and NTS3R primers (256 bp). (Middle) NTS2 PCR for P. piscicida with NTS2F and NTS4R primers (523 bp). (Bottom) Actin-PCR using G-480 and G-482 universal primers (≅730 bp). (−), negative control; (+), positive control with P. piscicida DNA (100 pg) for NTS1 and NTS2 PCR and P. piscicida actin clone (1 ng) for actin-PCR.
FIG. 3.
FIG. 3.
Sensitivity of PCR-based assay for P. piscicida. Shown are amplicons of 10-fold serial dilutions of P. piscicida DNA starting from 1 ng without background DNA (A), with 1 μg of Rhdomonas sp. DNA (B), with 1 μg of K. micrum DNA (C), and with 1 μg of COMB4872 DNA (D). The arrows indicate the limit of detection (10 fg of DNA). Although light bands can be observed at higher dilutions, the arrows indicate those that are clear under UV light with the naked eye. Fifteen microliters of a 20-μl PCR mixture was applied for electrophoresis. (−), negative control with sterile water.
FIG. 4.
FIG. 4.
Detection of P. piscicida in environmental sediment samples. DNA was extracted from sediment samples from eight individual locations and from water from a suspension of each sediment sample incubated for 7 days. P. piscicida was detected by NTS2 PCR. (+), positive with 100 pg of P. piscicida DNA; (−), negative control.
FIG. 5.
FIG. 5.
Construction and application of an internal-standard plasmid for NTS2 PCR assay. (A) Environmental sediment sample detection with twofold serial dilution. (B) Amplification of 10-fold dilution of pTNTS2 (a) and pMNTS2 (b) in 108 to 101 copies with 1 μg of Rhodomonas sp. DNA by NTS2 PCR. The 418- and 523-bp amplicons indicate the target and the internal standard PCR products, respectively. The arrows indicate the limit of detection (1 × 10³ copies). (C) Application of the internal standard to the detection of P. piscicida with DNA extracted from environmental sediment samples; a twofold serial dilution of sample DNA was amplified with 2 × 10⁴ spiked copies of pMNTS2. (D) Detection of P. piscicida with DNA of environmental sediment sample extracted by BIO101 kit for soil. (−), negative control; (+), positive control; (Is), positive control of an internal standard.
FIG. 6.
FIG. 6.
Effect(s) of the presence of EDTA in PCR. (A) Amplification of dilution of P. piscicida DNA (1 ng) in TE (10 μl) with sterile water in 20-μl PCR mixture. (B) PCR products of diluted P. piscicida DNA spiked into 10 μl of TE in a 20-μl reaction mixture on agarose gel. (C) Amplification of P. piscicida DNA extracted with sterile water or TE from cells spiked into sediment. (−), negative control; (+), positive control. The 523-bp PCR product indicates target amplification. The arrows indicate the limit of detection under UV light with the naked eye.
FIG. 7.
FIG. 7.
Detection sensitivity of P. piscicida PCR-based assay with DNA extracted with BIO101 kit for soil from P. piscicida cells spiked into autoclaved sediment (0.1 g). (Top) DNA from zoospores; (bottom) DNA from cysts. Amplicons corresponding to 102, 101, 1, and 0.1 P. piscicida cells were amplified with 103 copies of pMNTS2 and separated on agarose gels.
FIG. 8.
FIG. 8.
Amplification kinetics of pTNTS2 and pMNTS2 with NTS2F and NTS4R primers. pTNTS2 and pMNTS2 were amplified in the same reaction mixture. PCR products of the same copy numbers of both plasmids in 10-fold dilutions starting from 108 copies (A) and various numbers of each plasmid (B) were separated by electrophoresis. Fifteen microliters of a 20-μl PCR mixture was applied to each well, and the band intensities of target and competitor amplicons are plotted. ○, target amplicon (523 bp); □, pMNTS2 amplicon (418 bp); rfu, relative fluorescence units.
FIG. 9.
FIG. 9.
Validation of QC-PCR with pMNTS2 as a competitor. A constant amount of pTNTS2 (104 copies) (A) or P. piscicida DNA (500 pg) (B) was amplified with 10-fold dilutions of pMNTS2. ○, target amplicon (523 bp); □, pMNTS2 amplicon (418 bp); rfu, relative fluorescence units. The error bars indicate the standard deviation.
FIG. 10.
FIG. 10.
Correlation of one, two, and three cells of P. piscicida zoospore amplification and assessment of NTS region copy number in single P. piscicida zoospore by QC-PCR. (A) Cells were collected with a capillary tube and then added directly to the PCR mixture (20 μl). The averages of individual band intensities corresponding to each cell number are plotted, with error bars indicating standard deviation (n = 7). (B) Band intensities of PCR amplicons corresponding to 770 P. piscicida zoospores with 10-fold dilutions of pMNTS2 are plotted, with error bars indicating standard deviation (n = 3). ○, target amplicon (523 bp); □, pMNTS2 amplicon (418 bp).

References

    1. Allen, J. R., M. Roberts, A. R. Loeblich III, and L. C. Klotz. 1975. Characterization of the DNA from the dinoflagellate Crypthecodinium cohnii and implications for nuclear organization. Cell 6:161-169. - PubMed
    1. Anderson, D. M., and B. A. Keafer. 1985. Dinoflagellate cyst dynamics in coastal and estuarine waters, p. 219-224. In D. M. Anderson, A. W. White, and D. G. Baden (ed.), Toxic dinoflagellates. Elsevier, New York, N.Y.
    1. Ausubel, M. F., R. Brent, R. E. Kingston, D. Moore, J. G. Seidman, J. A. Smith, and K. Struhl. 1999. Escherichia coli, plasmids, and bacteriophages, p. 1-38. In M. F. Ausubel, R. Brent, R. E. Kingston, D. Moore, J. G. Seidman, J. A. Smith, and K. Struhl (ed.), Short protocols in molecular biology, 4th ed. John Wiley & Sons, Inc., Hoboken, N.J.
    1. Bena, G., M. F. Jubier, I. Olivieri, and B. Lejeune. 1998. Ribosomal external and internal transcribed spacers: combined use in the phylogenetic analysis of Medicago (Leguminosae). J. Mol. Evol. 46:299-306. - PubMed
    1. Bever, C. T., Jr., L. Grattan, and J. G. Morris. 1998. Neurologic symptoms following Pfiesteria exposure: case report and literature review. Md. Med. J. 47:120-123. - PubMed

Publication types

LinkOut - more resources