. 2002 Nov;68(11):5537-48.
doi: 10.1128/AEM.68.11.5537-5548.2002.

Robust hydrocarbon degradation and dynamics of bacterial communities during nutrient-enhanced oil spill bioremediation

Affiliations

Robust hydrocarbon degradation and dynamics of bacterial communities during nutrient-enhanced oil spill bioremediation

Wilfred F M Röling et al. Appl Environ Microbiol. 2002 Nov.

Abstract

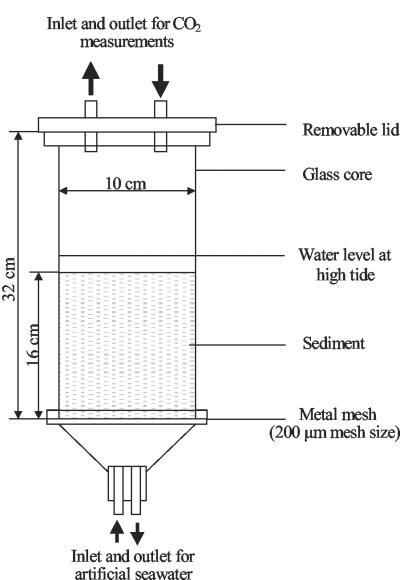
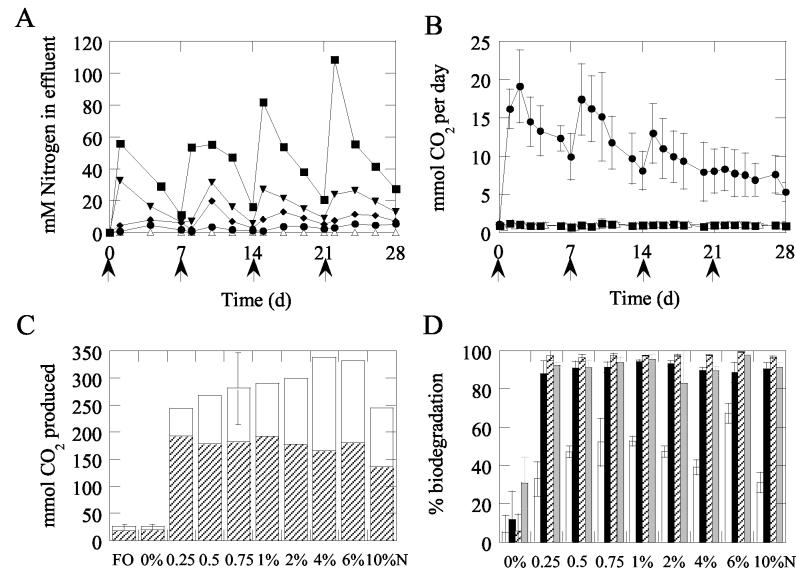
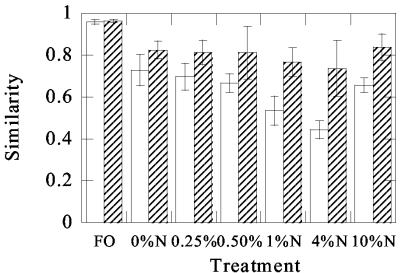
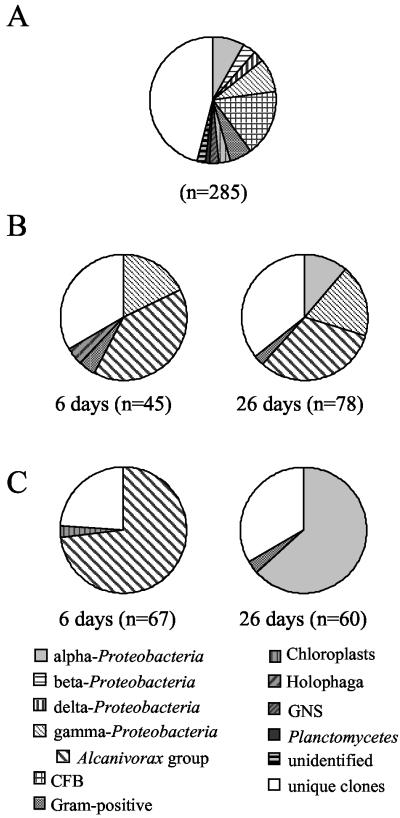
Degradation of oil on beaches is, in general, limited by the supply of inorganic nutrients. In order to obtain a more systematic understanding of the effects of nutrient addition on oil spill bioremediation, beach sediment microcosms contaminated with oil were treated with different levels of inorganic nutrients. Oil biodegradation was assessed respirometrically and on the basis of changes in oil composition. Bacterial communities were compared by numerical analysis of denaturing gradient gel electrophoresis (DGGE) profiles of PCR-amplified 16S rRNA genes and cloning and sequencing of PCR-amplified 16S rRNA genes. Nutrient amendment over a wide range of concentrations significantly improved oil degradation, confirming that N and P limited degradation over the concentration range tested. However, the extent and rate of oil degradation were similar for all microcosms, indicating that, in this experiment, it was the addition of inorganic nutrients rather than the precise amount that was most important operationally. Very different microbial communities were selected in all of the microcosms. Similarities between DGGE profiles of replicate samples from a single microcosm were high (95% +/- 5%), but similarities between DGGE profiles from replicate microcosms receiving the same level of inorganic nutrients (68% +/- 5%) were not significantly higher than those between microcosms subjected to different nutrient amendments (63% +/- 7%). Therefore, it is apparent that the different communities selected cannot be attributed to the level of inorganic nutrients present in different microcosms. Bioremediation treatments dramatically reduced the diversity of the bacterial community. The decrease in diversity could be accounted for by a strong selection for bacteria belonging to the alkane-degrading Alcanivorax/Fundibacter group. On the basis of Shannon-Weaver indices, rapid recovery of the bacterial community diversity to preoiling levels of diversity occurred. However, although the overall diversity was similar, there were considerable qualitative differences in the community structure before and after the bioremediation treatments.


Figures

FIG. 1.
FIG. 1.
Design of the microcosms used in this study.
FIG. 2.
FIG. 2.
Chemical data from microcosms. (A) amounts of nitrogen in residing seawater of beach microcosms over time. Symbols: ▵, 0% N; •, 1% N; ♦, 2% N; ▾, 4% N; ▪, 10% N. Arrows indicate addition of nutrients. (B) Daily carbon dioxide production, averaged over three independent runs, with bars indicating standard deviation, for microcosms. Symbols: ▵, FO; ▪, 0% N; •, 0.75% N. For the FO and 0% N microcosms, standard deviation symbols were often smaller than the data symbols. Arrows indicate addition of nutrients. (C) Cumulative carbon dioxide production in microcosms. The open portion of the column indicates production during the first 7 days; carbon dioxide production during the last 21 days of the experiment is shown by the hatched portion of the column. Standard deviations are shown by error bars for the microcosms prepared in triplicate (FO, 0% N, and 0.75% N). (D) Percentage of biodegradation of TPH (open), TRH (black), n11-to-n33 alkanes (hatched), and PAH (grey) per treatment. Error bars indicate standard deviations.
FIG. 3.
FIG. 3.
Bacterial community dynamics during oil spill bioremediation in beach microcosms. Examples of changes in 16S rDNA PCR-DGGE profiles over time in microcosms; unoiled microcosms (FO), oiled, untreated microcosms (0% N); and oiled microcosms amended with 0.25 and 10% nitrogen. The values above the lanes indicate the numbers of days elapsed since nutrient addition.
FIG. 4.
FIG. 4.
Similarities (Dice coefficient) in DGGE profiles from microcosms receiving different treatments. Open columns show average similarities of profiles observed at days 6, 13, 20, and 26, relative to day 0, for each treatment. The average values were obtained from pairwise comparisons of DGGE profiles obtained at each time point relative to the time zero sample for each individual treatment. Thus, the data for the FO treatment, for example, represent the mean similarity obtained from four pairwise comparisons (the mean of the day 0 profile compared to the day 6 profile, the day 0 profile compared to the day 13 profile, the day 0 profile compared to the day 20 profile, and the day 0 profile compared to the day 26 profile). Error bars (n = 4) indicate standard deviations. Hatched columns show average similarity between profiles observed at days 6, 13, 20, and 26 for each treatment. In this case, the mean values were obtained by averaging the pairwise similarities of the day 6 profile compared to the day 13 profile, the day 6 profile compared to the day 20 profile, the day 6 profile compared to the day 26 profile, the day 13 profile compared to the day 20 profile, the day 13 profile compared to the day 26 profile, and the day 20 profile compared to the day 26 profile. Error bars (n = 6) indicate standard deviations. These data indicate that most of the change in the DGGE profiles occurred between days 0 and 6, since the mean similarities for all pairwise comparisons from day 6 onward show little variation.
FIG. 5.
FIG. 5.
Comparison of the effects of nutrient amendment on bacterial community structure at particular sampling times. Examples of 16S rDNA PCR-DGGE profiles from microcosms receiving different nutrient amendments, showing profiles at days 13 and 26. The values above the lanes indicate treatments (described in Table 1).
FIG. 6.
FIG. 6.
Similarities (Dice coefficient) in DGGE profiles between different treatments at each time point. Shown are average similarities of profiles observed for oiled, nutrient-amended microcosms (0.25, 0.5, 1, 4, and 10% N) relative to the oiled, unamended control (○) and unoiled, nutrient-amended control (♦), respectively; average similarity between the different oiled, nutrient-amended microcosms (▪); and average similarity between DGGE profiles from replicate microcosms receiving the same nutrient amendment (0.75% N) (□). Error bars indicate standard deviations. To aid in visualization, symbols representing different comparisons have been slightly offset. For each time point, the average values were obtained from pairwise comparisons of DGGE profiles obtained for each treatment relative to the oiled, unamended control. Thus, the data for the day 6 time point, for example, represent the mean similarity obtained from five pairwise comparisons (the mean of the 0.25% N profile compared to the 0% N profile, the 0.5% N profile compared to the 0% N profile, the 1.0% N profile compared to the 0% N profile, the 4.0% N profile compared to the 0% N profile, and the 10% N profile compared to the 0% N profile). Similar comparisons were made between the fertilizer-only control and the other treatments. For microcosms that received oil and different nutrient amendments, all possible pairwise similarities were averaged to obtain the mean value. These data indicate that, at each time point other than day 0, the variation in DGGE profiles between replicate microcosms (□) is as great as the variation between different treatments (▪).
FIG. 7.
FIG. 7.
Relative contributions of different phylogenetic groups to microbial communities. (A) Microcosms not affected by oiling and remediation treatment (composed of five clone libraries [FO days 0, 6, and 26 and day 0 of the 0% N and 4.0% N microcosms]). (B) Oiled, untreated control (0% N) at days 6 and 26. (C) Oiled, 4% N-treated microcosm at days 6 and 26. CFB, Cytophaga-Flexibacter-Bacteroides; GNS, green non-sulfur bacteria.
FIG. 8.
FIG. 8.
Effect of oiling and bioremediation on changes in microbial diversity over time. The Shannon-Weaver index was calculated from the distribution of clones categorized on the basis of different ARDRA profiles. Symbols: ▵, FO; ▪, 0% N; •, 4% N.
FIG. 9.
FIG. 9.
Phylogenetic tree based on almost complete 16S rDNA gene sequences of α-proteobacterial (A) and γ-proteobacterial (B) clones occurring as dominant sequences in clone libraries of oiled microcosms. A neighbor-joining analysis with Jukes-and-Cantor correction was performed. Only bootstrap values of greater than 50% are shown.

References

    1. Altschul, S. F., W. Gish, W. Miller, E. W. Myers, and D. J. Lipman. 1990. Basic local alignment search tool. J. Mol. Biol. 215:403-410. - PubMed
    1. Atlas, R. M., and R. Bartha. 1972. Degradation and mineralization of petroleum in seawater: limitation by nitrogen and phosphorus. Biotech. Bioeng. 14:309-318. - PubMed
    1. Boufadel, M. C., P. Reeser, M. T. Suidan, B. A. Wrenn, J. Cheng, X. Du, T. H. L. Huang, and A. D. Venosa. 1999. Optimal nitrate concentration for the biodegradation of n-heptadecane in a variably-saturated sand column. Environ. Technol. 20:191-199.
    1. Bragg, J. R., R. C. Prince, E. J. Harner, and R. M. Atlas. 1994. Effectiveness of bioremediation for the Exxon-Valdez oil-spill. Nature 368:413-418.
    1. Bruns, A., and L. Berthe-Corti. 1999. Fundibacter jadensis gen. nov., sp. nov., a new slightly halophilic bacterium, isolated from intertidal sediment. Int. J. Syst. Bacteriol. 49:441-448. - PubMed

Publication types

LinkOut - more resources