. 2002 Nov;120(5):739-55.
doi: 10.1085/jgp.20028639.

Control of outer vestibule dynamics and current magnitude in the Kv2.1 potassium channel

Affiliations

Control of outer vestibule dynamics and current magnitude in the Kv2.1 potassium channel

Payam Andalib et al. J Gen Physiol. 2002 Nov.

Abstract

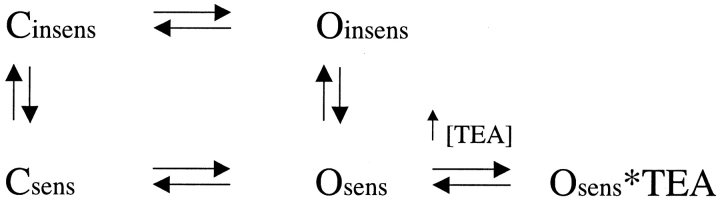
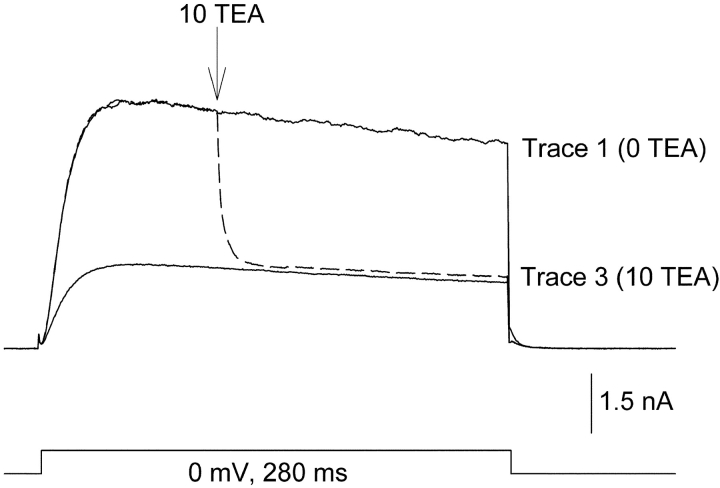
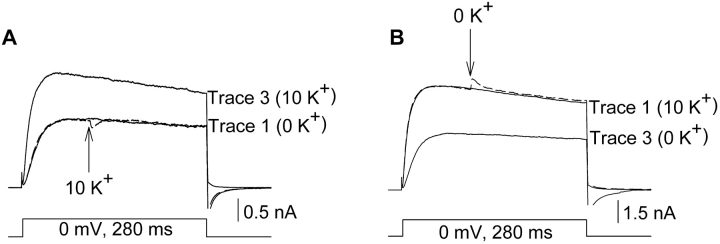
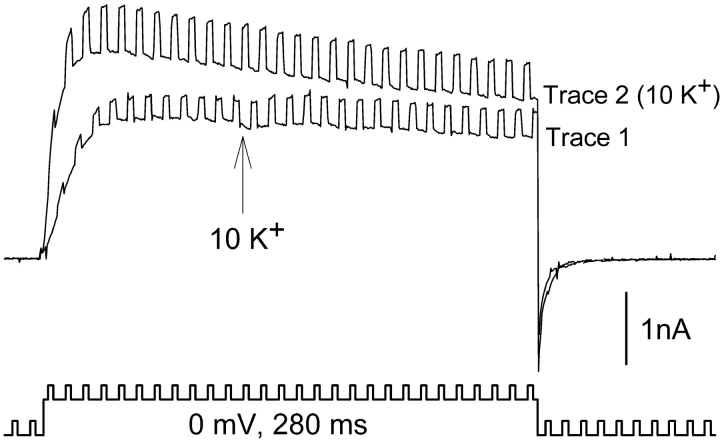
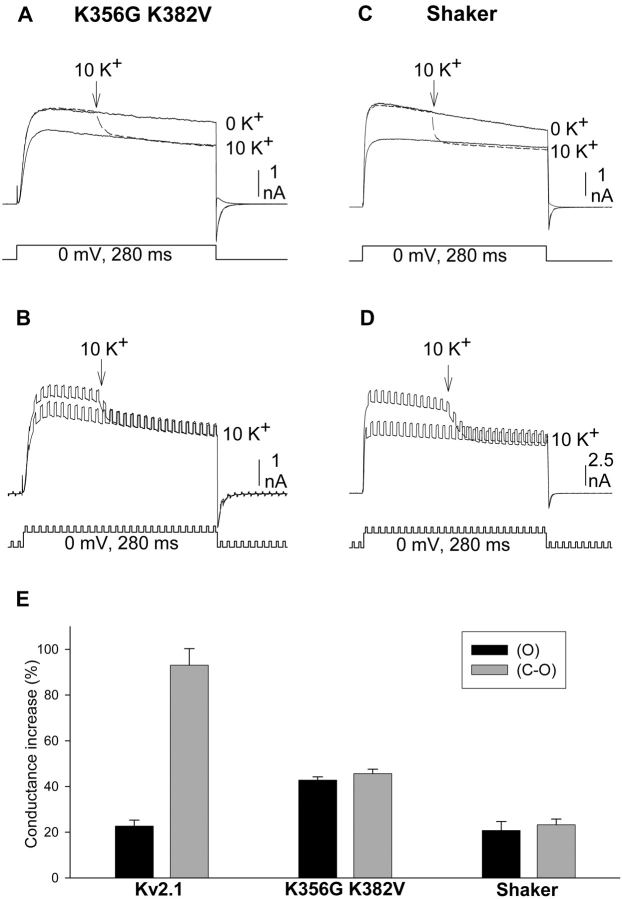
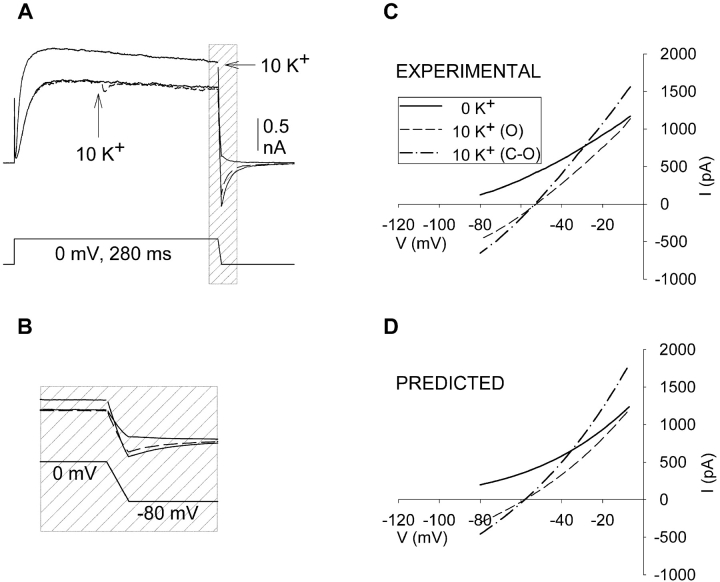
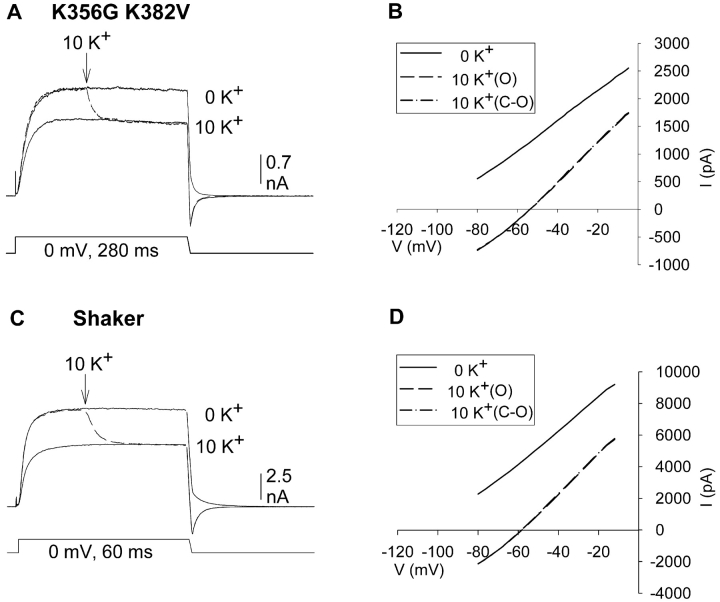
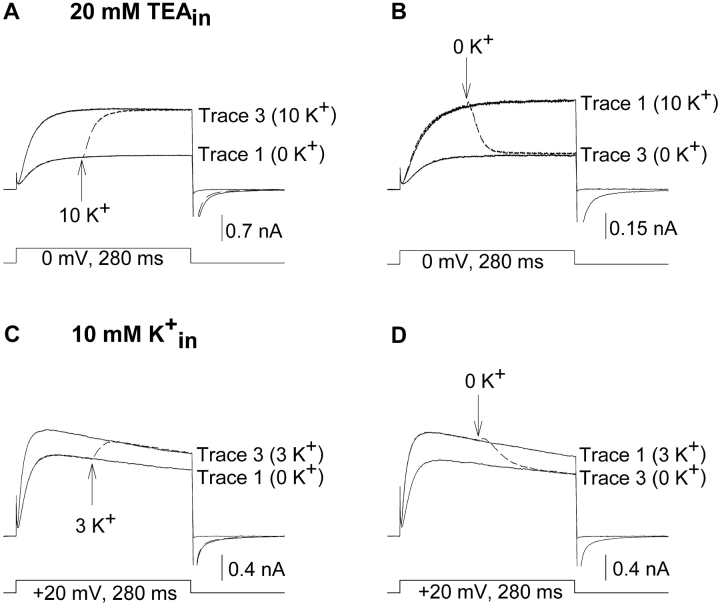
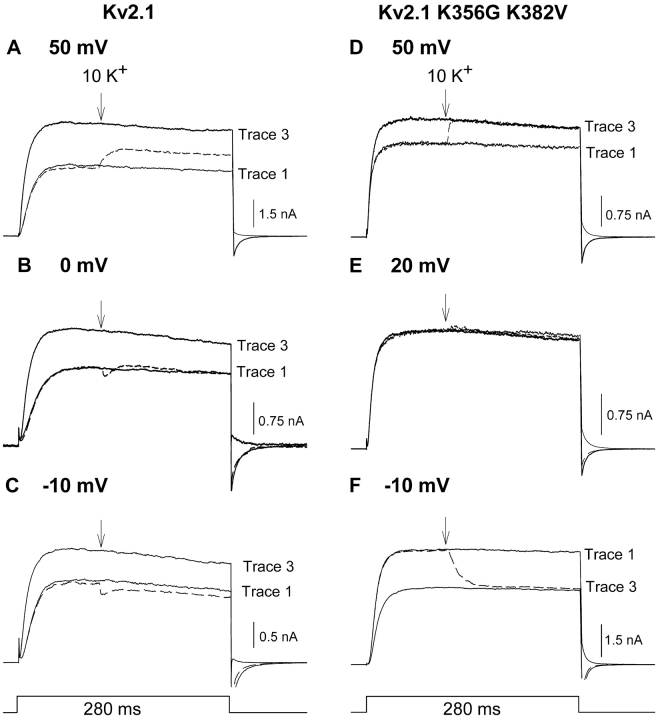
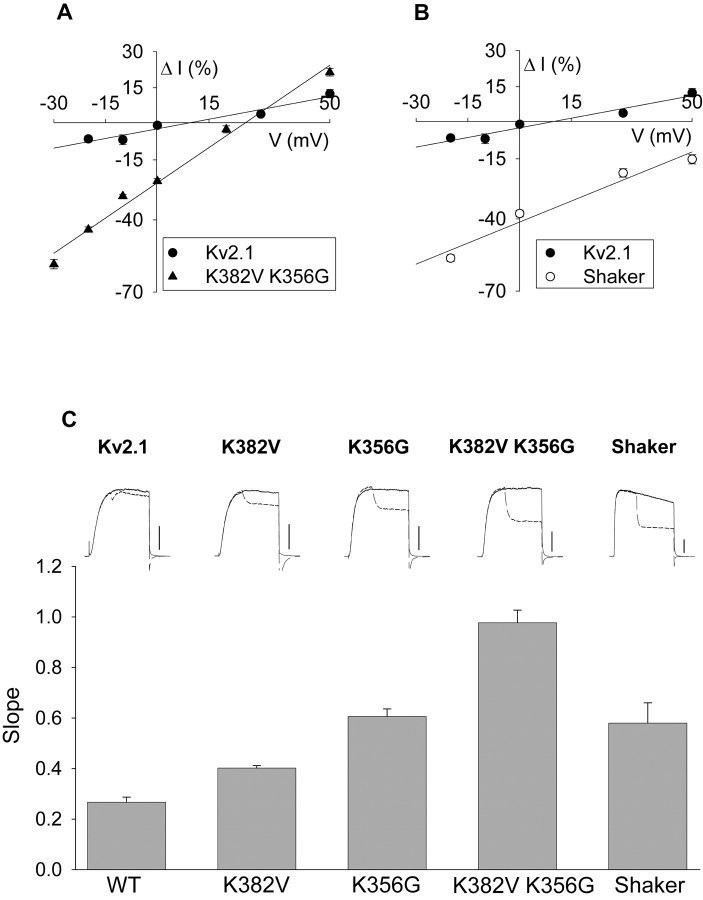
In Kv2.1 potassium channels, changes in external [K+] modulate current magnitude as a result of a K+-dependent interconversion between two outer vestibule conformations. Previous evidence indicated that outer vestibule conformation (and thus current magnitude) is regulated by the occupancy of a selectivity filter binding site by K+. In this paper, we used the change in current magnitude as an assay to study how the interconversion between outer vestibule conformations is controlled. With 100 mM internal K+, rapid elevation of external [K+] from 0 to 10 mM while channels were activated produced no change in current magnitude (outer vestibule conformation did not change). When channels were subsequently closed and reopened in the presence of elevated [K+], current magnitude was increased (outer vestibule conformation had changed). When channels were activated in the presence of low internal [K+], or when K+ flow into conducting channels was transiently interrupted by an internal channel blocker, increasing external [K+] during activation did increase current magnitude (channel conformation did change). These data indicate that, when channels are in the activated state under physiological conditions, the outer vestibule conformation remains fixed despite changes in external [K+]. In contrast, when channel occupancy is lowered, (by channel closing, an internal blocker or low internal [K+]), the outer vestibule can interconvert between the two conformations. We discuss evidence that the ability of the outer vestibule conformation to change is regulated by the occupancy of a nonselectivity filter site by K+. Independent of the outer vestibule-based potentiation mechanism, Kv2.1 was remarkably insensitive to K+-dependent processes that influence current magnitude (current magnitude changed by <7% at membrane potentials between -20 and 30 mV). Replacement of two outer vestibule lysines in Kv2.1 by smaller neutral amino acids made current magnitude dramatically more sensitive to the reduction in K+ driving force (current magnitude changed by as much as 40%). When combined, these outer vestibule properties (fixed conformation during activation and the presence of lysines) all but prevent variation in Kv2.1 current magnitude when [K+] changes during activation. Moreover, the insensitivity of Kv2.1 current magnitude to changes in K+ driving force promotes a more uniform modulation of current over a wide range of membrane potentials by the K+-dependent regulation of outer vestibule conformation.


Figures

SCHEME I
SCHEME I
F<sc>igure</sc> 1.
Figure 1.
Inhibition of K+ current by rapid application of TEA to activated channels. Three superimposed currents, recorded consecutively at 10-s intervals. (Trace 1) Outward current in the absence of TEA. (Trace 2, dashed line) Cells were activated in the absence of TEA. 100 ms after depolarization, the external solution was switched to one containing 10 mM TEA (at arrow). (Trace 3) Channels were closed and reactivated in the presence of 10 mM TEA. Complete solution change, as judged by the time required for 97% inhibition, occurred in 19.3 ± 0.6 ms (n = 9). The data were reasonably well fit by a single exponential, which produced a time constant of 3.47 ± 0.22 ms. There was no external K+ in this experiment.
F<sc>igure</sc> 2.
Figure 2.
Changing external [K+] when channels were activated did not affect current magnitude. All currents were activated by depolarization to 0 mV. (A, trace 1) Current recorded in the absence of external K+. (Trace 2, dashed line) Current was activated in the absence of external K+. 100 ms after depolarization (at the arrow), the external solution was switched to one containing 10 mM K+. Mean potentiation = −0.7 ± 0.7% (n = 6). (Trace 3) Channels were closed and reactivated in the presence of 10 mM external K+. Mean potentiation = 38.0 ± 6.0% (n = 6). (B) Converse experiment to A. (Trace 1) Current recorded in 10 mM K+. (Trace 2, dashed line) Current was activated in 10 mM external K+. 100 ms after depolarization, the external solution was switched to one containing 0 mM K+. Trace 3. Channels were closed and reactivated in the presence of 0 external K+.
F<sc>igure</sc> 3.
Figure 3.
Changing external [K+] when channels were activated had little effect on macroscopic conductance. To measure macroscopic conductance, 10 mV, 5-ms depolarizations were superimposed on the depolarization to 0 mV. (Trace 1) Channels were activated in the absence of external K+. At the arrow, external [K+] was changed to 10 mM. In this cell, conductance increased by 21% with essentially no change in current magnitude. In eight cells, the average conductance change was 22.7 ± 2.6%. (Trace 2) Channels were closed and reactivated in the presence of 10 mM external K+. In this cell, conductance increased by 110%. In eight cells, conductance increased by 93.1 ± 7.2%.
F<sc>igure</sc> 4.
Figure 4.
Response to changing external [K+] in channels without outer vestibule lysines. Protocols used were identical to those used in Figs. 2 and 3. (A and B) Recordings from Kv2.1 K356G K382V. (C and D) Recordings from Shaker. Currents were initially recorded in 0 mM K+ (shown in A and C, omitted for clarity in B and D). During the subsequent activation (dashed lines in A and C, larger currents in B and D), external [K+] was changed from 0 to 10 mM K+ (at the arrow). The third activation occurred after closing and reopening the channels in 10 mM K+. (E) The K+-dependent increase in conductance, measured from recordings as in B and D, obtained after the change in [K+] during the activation (black bars, O) and after closing and reopening the channels in 10 mM [K+] (gray bars, C-O). Bars represent seven cells in each group for Kv2.1 and K356G K382V, four cells in each group for Shaker.
F<sc>igure</sc> 5.
Figure 5.
K+-dependent changes in the I-V curve of Kv2.1 (A) Currents recorded as in Fig. 2, except that during the repolarization, membrane potential was ramped from 0 to −80 mV over a duration of 5 ms. Three superimposed currents are shown, one recorded in 0 external K+ (unlabeled solid line), one in which external [K+] was changed from 0 to 10 mM (at arrow, dashed line) during activation, and one after closing and reopening in 10 mM external K+. 300 μs of data were blanked at the end of the depolarization due to a program error in generating ramps in pClamp. (B) Current and voltage during repolarization illustrated on an expanded time scale. (C) Current plotted as a function of voltage during the repolarization. Similar results were obtained in seven cells. (D) Theoretical curves obtained from the Goldman-Hodgkin-Katz current equation (Eq. 1). Parameter values were obtained as described in the text.
F<sc>igure</sc> 6.
Figure 6.
K+-dependent changes in the I-V curves of channels lacking outer vestibule lysines. (A) Three superimposed currents through Kv2.1 K356G K382V, activated by 280 ms depolarization to 0 mV. Trace 1 was recorded in 0 mM K+. During trace 2, [K+] was changed from 0 to 10 mM (dashed line). Trace 3 was recorded after closing and reopening the channels in 10 mM K+. (B) I-V relationships for the three traces, measured during the repolarizing ramp. Measured Vrev for 10 K+ data: −51.3 ± 1.5 and −51.7 ± 1.5 (n = 3). Slope conductances, measured between −50 and −10 mV for 10 K+ data: 34.4 ± 2.8 and 35.6 ± 2.3 (n = 3). (C) Three superimposed currents recorded from Shaker using the same protocol as in A except that the depolarizing step was 60 ms in duration and the ramp was 2 ms in duration. (D) I-V relationships for the three traces shown in C, measured during the repolarizing ramp. Average measured Vrev for 10 K+ data: −53.8 ± 1.2 and −54.1 ± 1.2 (n = 5). Average slope conductances, measured between −50 and −10 mV for 10 K+ data: 21.8 ± 1.3 and 24.8 ± 1.9 (n = 5).
F<sc>igure</sc> 7.
Figure 7.
K+-dependent changes in current magnitude during activation at low K+ occupancy. (A and B) The protocol was identical to that of Fig. 2 except that 20 mM TEA was included in the recording pipet. 20 mM internal TEA blocked the channel by ∼90% (Immke et al., 1999). (A) Elevation of [K+] from 0 to 10 mM, 100 ms after channels were activated, resulted in potentiation during activation (dashed line). Potentiation was 97% complete in 61.8 ± 1.8 ms (n = 4; the data were reasonably well fit by a single exponential, which produced a time constant of 18.4 ± 1.4 ms.). (B) Reduction of [K+] from 10 mM to 0 mM, 100 ms after channels were activated, reduced current magnitude during activation (dashed line). The change in current magnitude was 97% complete in 62.3 ± 3.3 ms (n = 4; the data were reasonably well fit by a single exponential, which produced a time constant of 16.2 ± 1.2 ms). (C and D) The protocol was identical to that of Fig. 2 except that internal [K+] was 10 mM, and currents were recorded at 20 mV. (C) Trace 1 was recorded in 0 external K+. In trace 2 (dashed line), external [K+] was changed from 0 to 3 mM at the arrow. Trace 3 was recorded after closing and reopening the channels in 3 mM external K+. (D) Similar experiment as in C, except that currents were initially recorded in 3 mM external K+, and in trace 2 (dashed line), external [K+] was switched from 3 to 0 mM during activation (at arrow). Essentially identical results were obtained on three cells each for experiments in C and D.
F<sc>igure</sc> 8.
Figure 8.
K+-dependent changes in current magnitude during activation at different membrane potentials. The protocol used in all panels was the same as in Fig. 2, except that currents were recorded at different voltages. (A–C) Data from wild type Kv2.1, recorded at the membrane potentials shown. In all panels, trace 1 was recorded in 0 mM K+. In trace 2 (dashed line), current was activated in the absence of external K+. 100 ms after de-polarization (at the arrow), the external solution was switched to one containing 10 mM K+. In trace 3, channels were closed and reactivated in the presence of 10 mM external K+. (D–F) Data from Kv2.1 K356G K382V, recorded at the membrane potentials shown. Data represent essentially identical results obtained from 3–9 cells at each membrane potential.
F<sc>igure</sc> 9.
Figure 9.
Sensitivity of current magnitude in different channels to changes in external [K+]. (A–B) Data were derived from experiments in Fig. 8, where the percentage change in current was measured by comparing the current magnitude in trace 2 (dashed lines) to that in trace 1. Data for Kv2.1 in A and B are identical and were duplicated for ease of comparison to other channels. Straight lines are linear regression fits to the data. Each data point represents 3–9 cells tested. (C, top) Currents recorded from channels indicated at a membrane potential of −20 mV. Solid line is current recorded in 0 mM external K+. The dashed line illustrates current recorded when external [K+] was switched from 0 to 10 mM 100 ms after the start of the depolarization. Calibration bars, 0.5 nA for wild-type Kv2.1; 1 nA for all other channels. (C, bottom) Data were collected and linear regression fits obtained for all channels as in A and B. The slope of the regression is plotted on the ordinate.

References

    1. Baukrowitz, T., and G. Yellen. 1996. Use-dependent blockers and exit rate of the last ion from the multi-ion pore of a K+ channel. Science. 271:653–656. - PubMed
    1. Chung, S.-H., T.W. Allen, M. Hoyles, and S. Kuyucak. 1999. Permeation of ions across the potassium channel: Brownian dynamics studies. Biophys. J. 77:2517–2533. - PMC - PubMed
    1. Chung, S.-H., T.W. Allen, and S. Kuyucak. 2002. Modeling diverse range of potassium channels with Brownian dynamics. Biophys. J. 83:26–27. - PMC - PubMed
    1. Demo, S.D., and G. Yellen. 1992. Ion effects on gating of the Ca2+-activated K+ channel correlate with occupancy of the pore. Biophys. J. 61:639–648. - PMC - PubMed
    1. Doyle, D.A., J.M. Cabral, R.A. Pfuetzner, A. Kuo, J.M. Gulbis, S.L. Cohen, B.T. Chait, and R. MacKinnon. 1998. The structure of the potassium channel: molecular basis of K+ conduction and selectivity. Science. 280:69–77. - PubMed

Publication types

MeSH terms

Substances