Comparative Study
. 2002 Nov-Dec;4(6):510-22.
doi: 10.1038/sj.neo.7900272.

Met-HGF/SF signal transduction induces mimp, a novel mitochondrial carrier homologue, which leads to mitochondrial depolarization

Affiliations
Comparative Study

Met-HGF/SF signal transduction induces mimp, a novel mitochondrial carrier homologue, which leads to mitochondrial depolarization

Gil M Yerushalmi et al. Neoplasia. 2002 Nov-Dec.

Abstract

Met-hepatocyte growth factor/scatter factor (HGF/SF) signaling plays an important role in epithelial tissue morphogenesis, lumen formation, and tumorigenicity. We have recently demonstrated that HGF/SF also alters the metabolic activity of cells by enhancing both the glycolytic and oxidative phosphorylation pathways of energy production. Using differential display polymerase chain reaction, we cloned a novel gene, designated mimp (Met-Induced Mitochondrial Protein), which is upregulated in NIH-3T3 cells cotransfected with both HGF/SF and Met (HMH cells). Northern and Western blot analyses showed that mimp is induced in several Met-expressing cell lines following treatment with HGF/SF. Mimp encodes a 33-kDa protein that shows sequence homology to the family of mitochondrial carrier proteins (MCPs). Murine Mimp (mMimp) is expressed in a wide variety of tissues, exhibiting an expression pattern similar to Met. Predominant expression is seen in liver, kidney, heart, skeletal muscle, and testis. Using immunostaining for HA-tagged mMimp and a GFP-mMimp chimeric protein as well as subcellular fractionation, we determined that Mimp is primarily localized to the mitochondria. Ectopic expression of mMimp in the Met-responsive adenocarcinoma cell line, DA3, reduced the mitochondrial membrane potential (uncoupling activity). The extent of the mitochondrial depolarization positively correlated with the level of Mimp expression. Our results demonstrate that Mimp is a novel mitochondrial carrier homologue upregulated by Met-HGF/SF signal transduction, which leads to mitochondrial depolarization, and suggest novel links among tyrosine kinase signaling, mitochondrial function, and cellular bioenergetics.


Figures
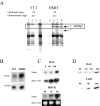
Figure 1
Figure 1
Identification of a novel HGF/SF-induced gene designated Mimp and the time course of its mRNA and protein induction in mammalian cells. (A) DD RT-PCR reactions were performed in quadruplicates and 35S-labeled PCR products were visualized by autoradiography. Lanes 1 to 4: NIH-3T3 mRNA; lanes 5 to 8: HMH mRNA. Arrows indicate candidate PCR products that are differentially regulated. The upper arrow [6] indicates a fragment of a novel gene designated mimp. (B) Northern analysis using murine mimp as a probe. Ten micrograms of RNA from NIH-3T3 fibroblasts and HMH cells was analyzed. Hybridization to a GAPDH probe was used as control. (C) Northern analysis using murine mimp as a probe. DA3 and MDCK Cells were exposed to 80 U/ml HGF/SF for 0, 4, and 24 hours or 0, 3, and 6 hours, respectively. RNA was prepared and the blot was probed with mouse mimp probe. 18S rRNA was used as control. (D) Western blot analysis using anti-Mimp antibody as a probe. DA3 and T47D cells were exposed to 80 U/ml HGF/SF for 0, 4, 8, or 24 hours. Cell lysates were prepared, separated on a 12% SDS polyacrylamide gel, and subjected to Western blot analysis with rabbit anti-Mimp antibody.
Figure 2
Figure 2
Expression of mimp and met mRNA in adult mouse tissues. (A) Northern blot analysis of mouse mimp. Samples of 10 µg of total RNA from various mouse tissues were probed with a murine met probe. The same membrane was reprobed with murine mimp. EtBr staining of 18S shows the relative levels of RNA in each lane. (B) Dot blot analysis of mouse mimp expression. Mouse RNA Master Blot (Clontech) containing poly(A)+ RNA samples from various mouse tissues was probed with murine mimp probe.
Figure 3
Figure 3
Mimp shares sequence homology with mitochondrial carrier proteins. (A) Alignment of the predicted amino acid sequence of human Mimp (MTCH2) with those of bovine, mouse, and zebra fish Mimp and with a murine Mimp homologue (PSAP/MTCH1). The mitochondrial energy transfer signature is depicted in a solid bold line; the homology to the mitochondrial carrier protein PFAM is depicted in a dashed line. The consensus sequence is depicted in the lower row. The symbols $, #, !, and % represent neutral, polar, aliphatic, and aromatic residues, respectively. (B) A phylogenetic tree of the Mimp subfamily, the UCP subfamily, and other mitochondrial carrier proteins, constructed using ClustalW.
Figure 4
Figure 4
Mimp shares structural homology with mitochondrial carrier proteins. (A) Comparison of sequence repeat analysis of mouse Mimp (black) and mouse ADP/ATP translocase (blue). Repeat analysis was performed using the GCG package. Arrows point to repeat sequences. (B) Comparison of the hydropathic profile of mouse Mimp (upper panel), mouse ADP/ATP translocase (middle panel), and mouse UCP3 (lower panel) using the Kyte-Doolittle method with a window size of 19. The six putative transmembrane domains are depicted above in Roman letters. (C) Organization of the human Mimp gene, exons 1 to 13 (depicted as boxes), based on the published genomic sequence.
Figure 5
Figure 5
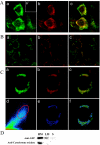
Mimp is localized to the mitochondrial membrane. (A) CLSM analysis of NIH-3T3 stably transfected with HA-Mimp stained with anti-HA antibody (a) and with MitoTracker Red (b). For colocalization analysis, the green and red images were overlaid (c). The yellow staining represents regions of colocalization. As a negative control, cells transfected with a control vector were stained with anti-HA antibody (a0). (B) CLSM analysis of NIH-3T3 cells stably transfected with Mimp-GFP (a) and stained with MitoTracker Red (b). The colocalization image is shown in (c). (C) CLSM analysis of 293T cells transiently transfected with Mimp-GFP (a) and stained with MitoTracker Red (b). For colocalization analysis, the green and the red images were overlaid (c). Graphic depiction of pixel intensities of image was performed (d). A region of maximal colocalization was selected in the graph (circled in red) and the pixels with colocalized values are represented in blue (e) and overlaid on the colocalization image (f). (D) Western blot analysis of subcellular fractions of Mimp-GFP transfected 293T. HM, fraction enriched for mitochondria; LM, light membrane fraction; S, cytosolic fraction. Mimp-GFP protein was detected predominantly in the HM fraction using an anti-GFP antibody. The same blot was stripped and the mitochondrial fraction detected with an antibody against the mitochondrial-specific protein cytochrome oxidase.
Figure 6
Figure 6
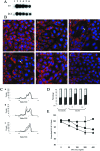
Ectopic expression of Mimp in DA3 cells leads to mitochondrial membrane depolarization. (A) Northern blot analysis of Mimp-inducible DA3 clones (77,212) with a murine mimp probe following 48 hours of treatment with 0, 1000, 500, 250, 100, and 50 ng/ml Dox (lanes 1–6, respectively). (B) CLSM images of Mimp-inducible cells stained with MitoTracker Red and DAPI following 48 hours of treatment with 0, 100, 200, 350, and 500 ng/ml Dox (images a–e, respectively). (f) The same cells treated with 100 µM CCCP 20 minutes before staining with MitoTracker Red. (C) Flow cytometry analysis of mitochondrial membrane potential was performed on Mimp-inducible DA3 cells using JC-1. The red/green fluorescence intensity ratio of each cell is proportional to the mitochondrial membrane potential (Δψm). The frequency histogram of the ratio between the red and green JC-1 fluorescence of each stained cell is depicted. The continuous line represents untreated cells; the broken line represents cells exposed to 200 ng/ml Dox for 48 hours. (a) Parental noninducible clone 7; (b) Mimp-inducible clone 77; (c) Mimp-inducible clone 212. (D) Stacked bar graph of the percentage of the depolarized cell population (black dashed bar) and nondepolarized cell population (white dotted bar). The cutoff between the polarized and nondepolarized cell population was chosen as the median of the noninducible clone (clone 7) without Dox treatment. (E) The average red/green JC-1 ratio of the cell populations following 48 hours of treatment with different Dox concentrations was calculated and normalized. Parental noninducible clone 7 (circles); Mimp-inducible clone 77 (squares); Mimp-inducible clone 212 (triangles).

References

    1. Altschul SF, Madden TL, Schaffer AA, Zhang J, Zhang Z, Miller W, Lipman DJ. Gapped BLAST and PSI-BLAST: a new generation of protein database search programs. Nucleic Acids Res. 1997;25:3389–3402. - PMC - PubMed
    1. Arsenijevic D, Onuma H, Pecqueur C, Raimbault S, Manning BS, Miroux B, Couplan E, Alves-Guerra MC, Goubern M, Surwit R, et al. Disruption of the uncoupling protein-2 gene in mice reveals a role in immunity and reactive oxygen species production. Nat Genet. 2000;26:435–439. - PubMed
    1. Bauer D, Warthoe P, Rohde M, Strauss M. Detection and differential display of expressed genes by DDRT-PCR. PCR Methods Appl. 1994;4:S97–S108. - PubMed
    1. Berdichevsky F, Alford D, D'Souza B, Taylor Papadimitriou J. Branching morphogenesis of human mammary epithelial cells in collagen gels. J Cell Sci. 1994;107:3557–3568. - PubMed
    1. Birchmeier C, Gherardi E. Developmental roles of HGF/SF and its receptor, the c-Met tyrosine kinase. Trends Cell Biol. 1998;8:404–410. - PubMed

Publication types

MeSH terms

LinkOut - more resources