. 2002 Nov 12;99(23):14819-24.
doi: 10.1073/pnas.192574799. Epub 2002 Oct 30.

Molecular characterization of mouse gastric epithelial progenitor cells

Affiliations

Molecular characterization of mouse gastric epithelial progenitor cells

Jason C Mills et al. Proc Natl Acad Sci U S A. .

Abstract

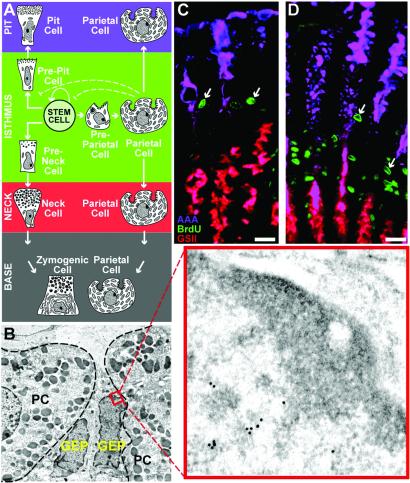
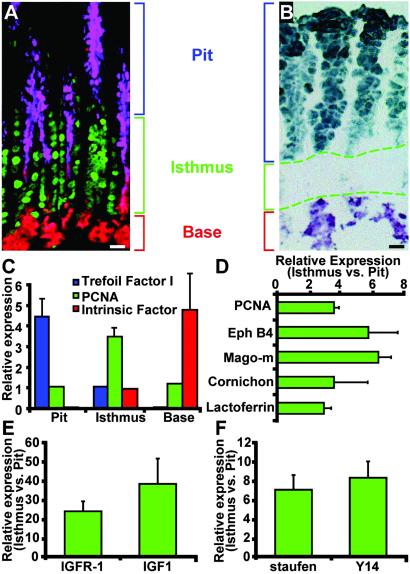
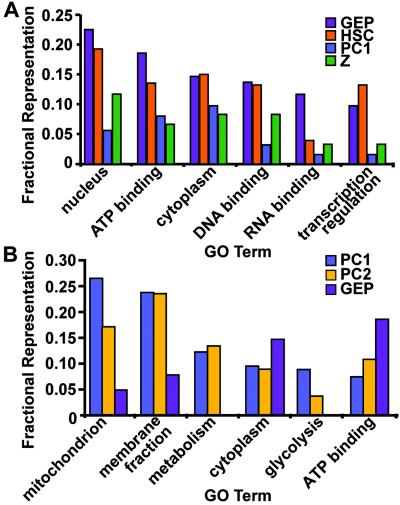
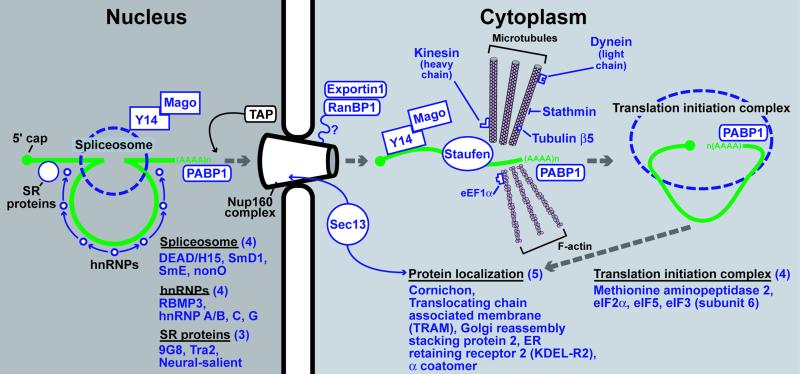
The adult mouse gastric epithelium undergoes continuous renewal in discrete anatomic units. Lineage tracing studies have previously disclosed the morphologic features of gastric epithelial lineage progenitors (GEPs), including those of the presumptive multipotent stem cell. However, their molecular features have not been defined. Here, we present the results of an analysis of genes and pathways expressed in these cells. One hundred forty-seven transcripts enriched in GEPs were identified using an approach that did not require physical disruption of the stem cell niche. Real-time quantitative RT-PCR studies of laser capture microdissected cells retrieved from this niche confirmed enriched expression of a selected set of genes from the GEP list. An algorithm that allows quantitative comparisons of the functional relatedness of automatically annotated expression profiles showed that the GEP profile is similar to a dataset of genes that defines mouse hematopoietic stem cells, and distinct from the profiles of two differentiated GEP descendant lineages (parietal and zymogenic cell). Overall, our analysis revealed that growth factor response pathways are prominent in GEPs, with insulin-like growth factor appearing to play a key role. A substantial fraction of GEP transcripts encode products required for mRNA processing and cytoplasmic localization, including numerous homologs of Drosophila genes (e.g., Y14, staufen, mago nashi) needed for axis formation during oogenesis. mRNA targeting proteins may help these epithelial progenitors establish differential communications with neighboring cells in their niche.


Figures

Fig 1.
Fig 1.
Parietal cell ablation produces GEP amplification in tox176 mice. (A) Schematic representation of a gastric unit in the middle third of a normal adult mouse stomach. The unit contains four compartments: pit, isthmus, neck, and base. The multipotent stem cell in the isthmus gives rise to three principal epithelial lineages (pit, parietal, and zymogenic). Only PCs differentiate within the isthmal stem cell niche. They then undergo a bidirectional migration to the pit and base regions. (B) EM immunohistochemical study showing juxtaposition of two mitochondria-rich PCs and two granule-free GEPs in the isthmus of a normal adult mouse gastric unit. PCs are outlined by dashes. The boxed region in one GEP (and the higher power Inset) shows a portion of the nucleus labeled with goat anti-PCNA and 18-nm-diameter gold particle-conjugated donkey anti-goat Ig. (C and D) Multilabel study of a 16-week-old normal germ-free mouse (C) and an age-matched conventionally raised tox176 animal (D). Each mouse received an i.p. injection of BrdUrd 90 min before sacrifice. Purple, pit cells labeled with Alexafluor 647-AAA; red, neck cells tagged with biotinylated GSII and Alexafluor 594- streptavidin; green, isthmal S-phase progenitors detected with goat anti-BrdUrd and Alexafluor 488-donkey anti-goat Ig. Note marked expansion of S-phase cells (e.g., arrows) in PC-ablated tox176 gastric units. (Bars, 25 μm.)
Fig 2.
Fig 2.
qRT-PCR studies of gene expression in GEPs obtained by n-LCM. (A) Multilabel study of a section prepared from paraffin-embedded tissue, showing distribution of pit, GEP, and neck cells in gastric units from a 16-week-old tox176 mouse. Purple, pit cells visualized with AAA; green, PCNA-positive GEPs; red, GSII-positive neck cells. (B) Representative image template used for n-LCM. The cryosection was stained with AAA and GSII. Dashed lines outline isthmal regions of several adjacent gastric units. (C) qRT-PCR assays of the purity of LCM populations. For trefoil factor 1 and intrinsic factor mRNAs, mean values are expressed relative to the concentration in captured isthmal cells (set at 1). PCNA mRNA levels are expressed relative to pit cells. Results are representative of five independent dissections. (D) LCM/qRT-PCR assays of GEP database mRNAs in isthmal versus pit fractions. Mean values ± 1 SD of two to five separate experiments (n = 4 mice) are plotted. In each case, the difference in levels is statistically significant (P < 0.05, Student's t test). (E and F) LCM/qRT-PCR study of genes not in the original GEP dataset but known to be involved in IGF responses (E) and mRNA localization (F). (Bars, 25 μm.)
Fig 3.
Fig 3.
Fractional representations of GO terms in GEP, PC, zymogenic (Z), and hematopoietic stem cell (HSC) datasets. (A) Six most frequent GO terms in the GEP dataset with corresponding FR in another progenitor population (HSCs) and in two terminally differentiated GEP descendant lineages (PC1 and Z). (B) Six most frequent GO terms in a previously published PC dataset (PC1; ref. 23), compared with their representation in a dataset generated from PCs that were isolated using a different method (PC2), and in the GEP dataset. Further information about the hierarchical GO-term classification scheme can be obtained from the Gene Ontology web site (www.geneontology.org/).
Fig 4.
Fig 4.
GEP-enriched transcripts encoding proteins involved in nuclear mRNA processing and export, cytoplasmic localization, and translation. Schematic representation of the processing of a single intronic sequence from an idealized RNA polymerase II transcript and movement of the product through the nuclear pore to a cytoplasmic site of translation and protein localization. Green, mRNA transcript; blue, present in the GEP dataset and/or confirmed by qRT-PCR analysis of laser capture microdissected GEPs; black, components of the pathway.

Comment in

  • Zeroing in on the "holy grail".
    Erwin CR, Jarboe M, Warner BW. Erwin CR, et al. Gastroenterology. 2003 Jul;125(1):266-7; discussion 267. doi: 10.1016/s0016-5085(03)00831-x. Gastroenterology. 2003. PMID: 12851898 No abstract available.

References

    1. Karam S. M. & Leblond, C. P. (1993) Anat. Rec. 236, 259-279. - PubMed
    1. Karam S. M. & Leblond, C. P. (1993) Anat. Rec. 236, 280-296. - PubMed
    1. Karam S. M. & Leblond, C. P. (1993) Anat. Rec. 236, 297-313. - PubMed
    1. Karam S. M. (1993) Anat. Rec. 236, 314-332. - PubMed
    1. Li Q., Karam, S. M. & Gordon, J. I. (1996) J. Biol. Chem. 271, 3671-3676. - PubMed

Publication types

MeSH terms