. 2002 Nov 1;21(21):5745-55.
doi: 10.1093/emboj/cdf564.

Plo1(+) regulates gene transcription at the M-G(1) interval during the fission yeast mitotic cell cycle

Affiliations

Plo1(+) regulates gene transcription at the M-G(1) interval during the fission yeast mitotic cell cycle

Mark Anderson et al. EMBO J. .

Abstract

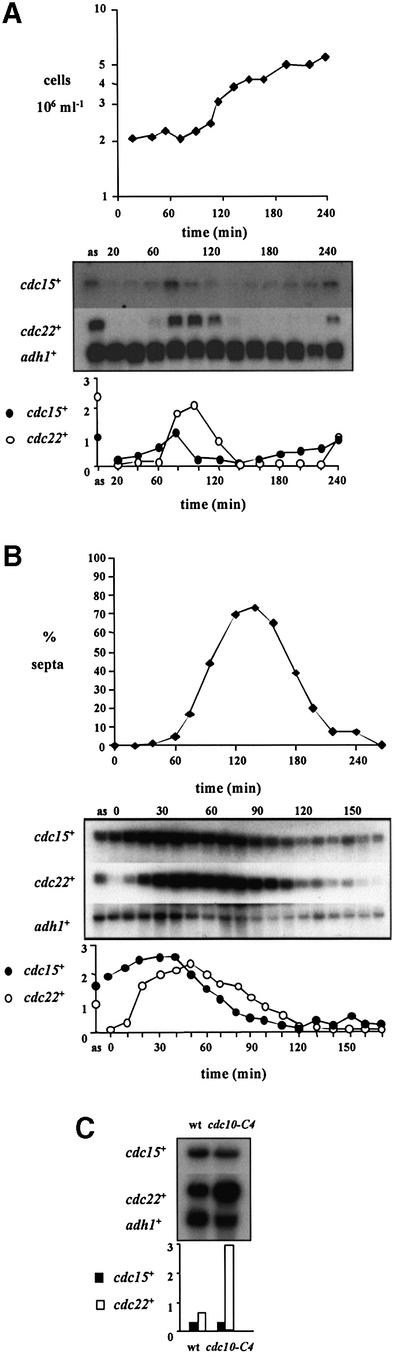
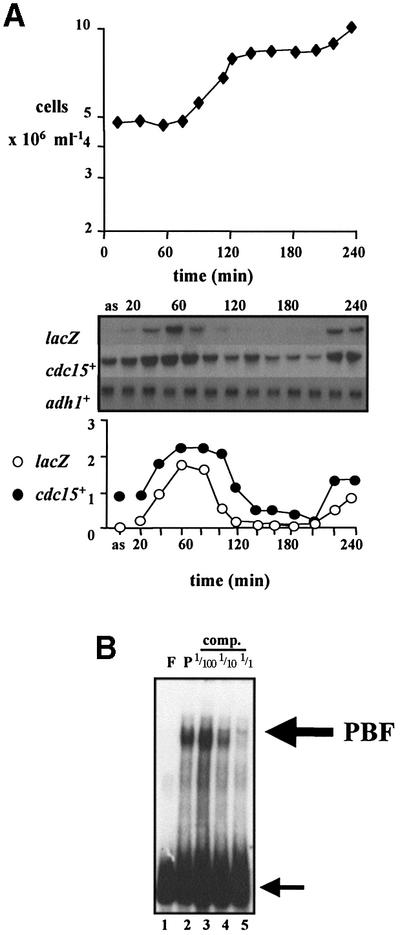
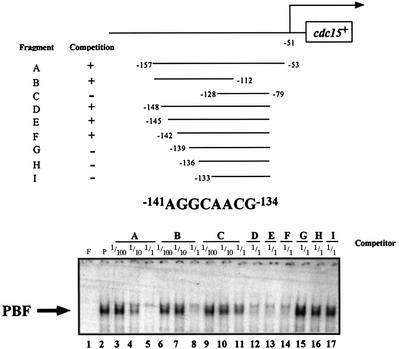
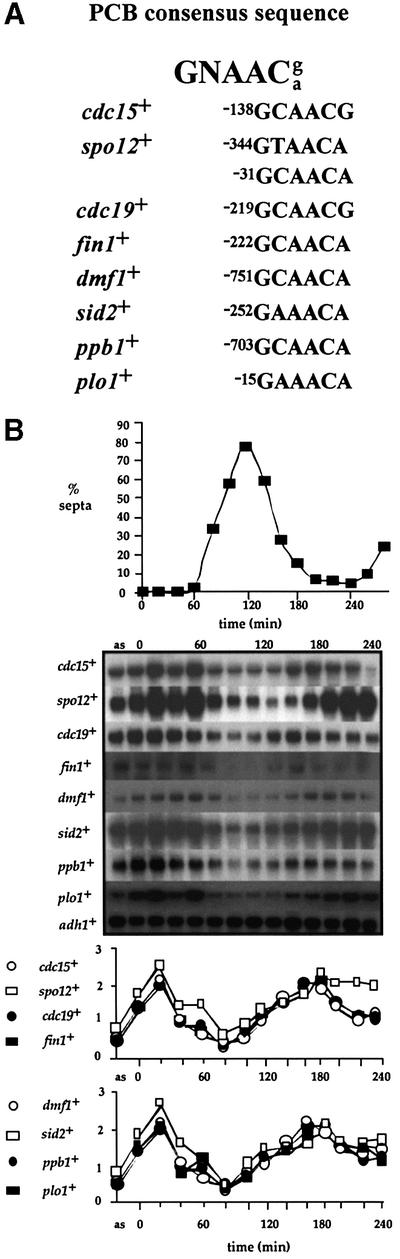
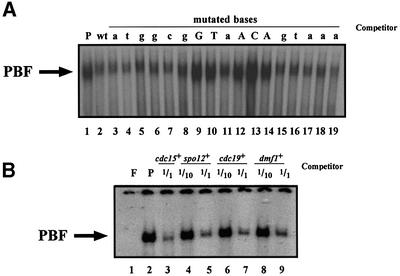
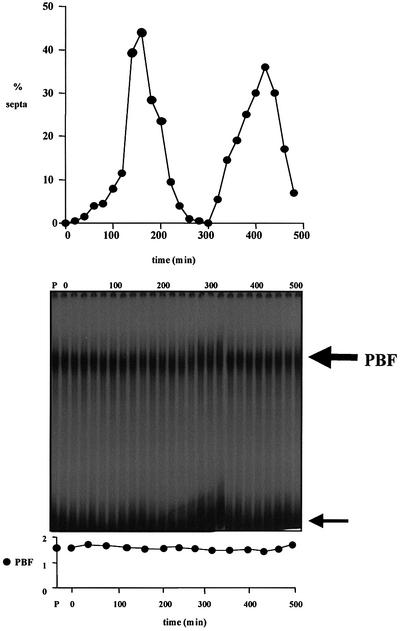
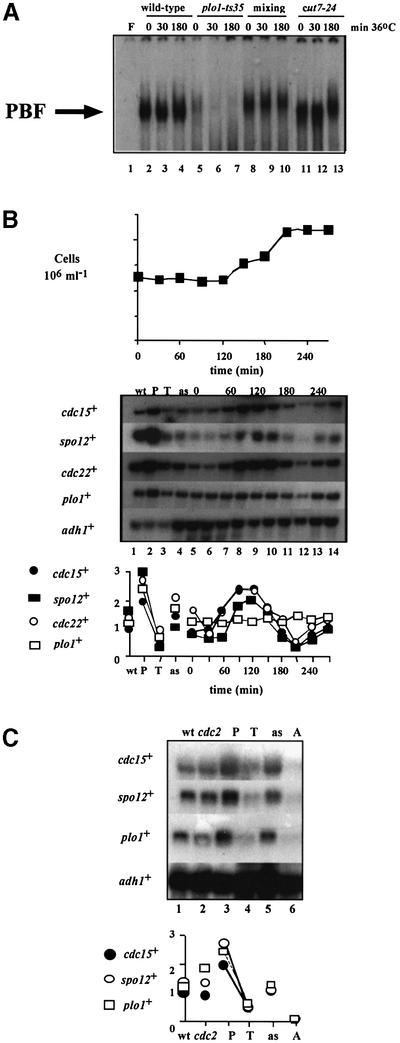
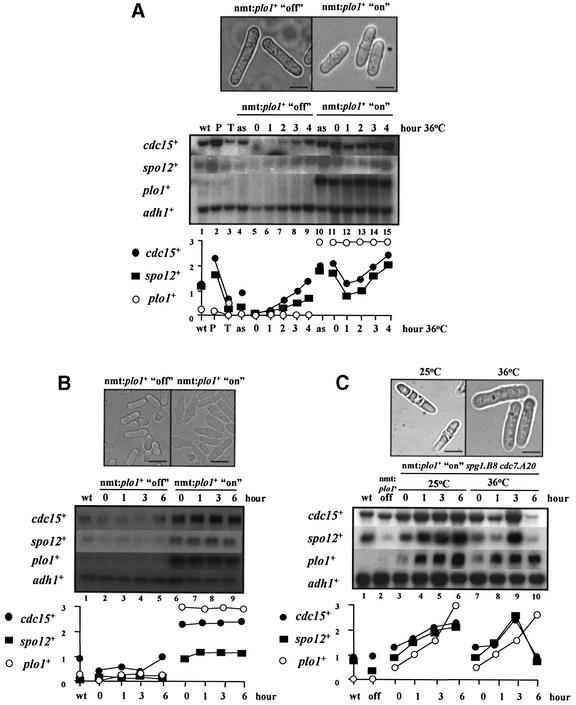
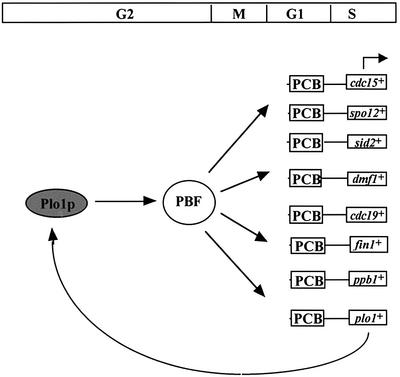
The regulation of gene expression plays an important part in cell cycle controls. We describe the molecular machinery that co-ordinates gene transcription at the M-G(1) interval during the fission yeast mitotic cell cycle. A sequence is identified in the cdc15(+) promoter that we call a PCB (pombe cell cycle box), which confers M-G(1)-specific transcription. Sequences similar to the PCB are present in the promoters of seven other genes, spo12(+), cdc19(+), fin1(+), sid2(+), ppb1(+), mid1(+)/dmf1(+) and plo1(+), which we find to be transcribed at M-G(1). A transcription factor complex is identified that binds to the PCB sequence, which we name PBF, for PCB-binding factor. Finally, we show that PBF binding activity and consequent gene transcription are regulated by the Plo1p protein kinase, thus invoking a potential auto-feedback loop mechanism that regulates mitotic gene transcription and passage through septation and cytokinesis.


Figures

None
Fig. 1. cdc15+ is expressed before MCB-regulated genes in the fission yeast cell cycle, and is not controlled by DSC1. (A) A population of wild-type cells (972h), synchronous for division, were size selected by centrifugal elutriation at 32°C, and cell samples taken every 20 min for northern blot analysis of RNA. ‘as’ indicates RNA prepared from asynchronously dividing cells prior to elutriation. The blot was hybridized consecutively with cdc15+, cdc22+ and adh1+ probes, the latter as a loading control. Quantification of each transcript against adh1+ is shown. (Bcdc25-22 cells were synchronized for cell division by transient temperature shifts. Northern blot analysis was performed on RNA samples prepared from cell samples taken at 10 min intervals following release from restrictive temperature. The blot was hybridized consecutively with cdc15+, cdc22+ and adh1+ probes, the latter as a loading control. Quantification of each transcript against adh1+ is shown. The degree of synchrony is indicated by the septation index. (C) RNA was prepared from cultures of wild-type (972h) and cdc10-C4 cells grown at 25°C, and subjected to northern blot analysis. The membrane was hybridized consecutively with cdc15+, cdc22+ and adh1+ probes, the latter as a loading control. Quantification of each transcript against adh1+ is shown.
None
Fig. 2. Characterization of a region of the cdc15+ promoter that confers M–G1 transcription, and identification of a transcription factor complex, PBF, that binds to it. (A) A fragment from the cdc15+ promoter was inserted into pSPΔ178 (Lowndes et al., 1992) to create pSPΔ178. 15UAS, transformed into wild-type cells, and cells synchronous for division were size selected by centrifugal elutriation at 32°C, with samples taken every 20 min for northern blot analysis of RNA. ‘as’ indicates RNA prepared from asynchronously dividing cells prior to elutriation. The blot was hybridized consecutively with lacZ, cdc15+ and adh1+ probes, the latter as a loading control. Quantification of each transcript against adh1+ is shown. (B) The same cdc15+ promoter fragment as in (A) was used as labelled probe in gel retardation analysis with total fission yeast protein extracts. Lane F, free probe; lane P, 20 µg of protein with probe. Competition reactions were performed with the same unlabelled cdc15+ promoter DNA with 1/100, 1/10 and 1 M excess. The large arrow indicates PBF, and the small arrow indicates free probe.
None
Fig. 3. Mapping of the interaction site between PBF and the cdc15+ promoter. Gel retardation analysis was performed using the cdc15+ promoter fragment as labelled probe. Lane F, free probe; lane P, 20 µg of protein with probe. Competition reactions were performed with unlabelled DNAs corresponding to different fragments of the cdc15+ promoter, designated with the letters A–I, with 1/100, 1/10 and 1 M excess, as indicated.
None
Fig. 4. A group of seven genes are expressed during mitosis in fission yeast coincident with cdc15+. (A) Predicted consensus sequence for the PCB element in fission yeast. Sequences related to the PCB consensus present in M–G1-expressed gene promoters are listed, with numbers referring to their position relative to each gene’s ATG. (Bcdc25-22 cells were synchronized for cell division by transient temperature shifts. Northern blot analysis was performed on RNA from cell samples taken at 20 min intervals following release from the restrictive temperature. ‘as’ indicates RNA prepared from asynchronously dividing cells prior to temperature shifts. The blot was hybridized consecutively with cdc15+, spo12+, cdc19+, mid1+/dmf1+, fin1+, sid2+, ppb1+, plo1+ and adh1+ probes, the latter as a loading control. Quantification of each transcript against adh1+ is shown. The degree of synchrony achieved is indicated by the septation index.
None
Fig. 5. Defining the PCB sequence. (A) Base pairs required in spo12+ PCB to bind PBF. Gel retardation analysis was performed using the cdc15+ promoter fragment as labelled probe. Lane P, 20 µg of protein with probe. Competition reactions were performed using cold DNA fragments corresponding to the spo12+ PCB, where single consecutive bases were mutated in separate DNAs, with A/T to G, or C/G to T, with 1 M excess. The central GT and ACA are required for successful competition with PBF. (B) PBF binds promoter fragments containing PCB sequences from other genes transcribed at M–G1 during mitosis. Gel retardation analysis was performed using the cdc15+ promoter fragment as labelled probe. Lane F, free probe; lane P, 20 µg of protein with probe. In alternate lanes, 1 and 1/10 M excess unlabelled competitor promoter DNA fragments from various fission yeast mitotic M–G1-expressed genes was added to the reaction mixture prior to electrophoresis.
None
Fig. 6. Cell cycle binding of PBF to PCBs. A population of wild-type cells (972h) synchronous for division were size selected by centrifugal elutriation at 25°C, and cell samples taken every 20 min for gel retardation analysis. PBF was detected using the cdc15+ promoter fragment as labelled probe with 20 µg of protein in each sample. Lane P, 20 µg of protein from asynchronous cells with probe. The large arrow indicates PBF, and the small arrow indicates free probe. The ratio of PBF to free probe is plotted.
None
Fig. 7. plo1-ts35 affects PBF in vitro and PCB-regulated gene transcription in vivo. (A) Gel retardation analysis was performed using the cdc15+ promoter fragment as labelled probe with 20 µg of protein extracts from wild-type (972h), plo1-ts35 and cut7-24 cells grown at permissive (25°C) and restrictive temperatures (36°C), for the indicated times. In the mixing experiment, protein extracts from wild-type and plo1-ts35 cells were mixed before electrophoresis. Lane F indicates free probe. (B) Cell cycle transcription of cdc15+, spo12+ and plo1+ in plo1-ts35 cells. A population of plo1-ts35 cells, synchronous for division, was size selected by centrifugal elutriation at 25°C. Cell samples were taken before elutriation (as) and at 30 min intervals after elutriation for northern blot analysis of RNA. Control RNA samples from asynchronous wild-type (972h) cells (wt), and peak (P) and trough (T) cdc15+ mRNA cell cycle samples from the experiment shown in Figure 1A were included. The blot was hybridized consecutively with cdc15+, spo12+, cdc22+ and adh1+ probes, the latter as a loading control. Quantification of each transcript against adh1+ is shown. (C) Transcription of cdc15+, spo12+ and plo1+ in plo1-ts35 cdc2-33 arrested cells. plo1-ts35 cdc2-33 cells were cell cycle arrested by temperature shift after enriching for early G2 cells by elutriation (Tanaka et al., 2001). Cell samples were taken before elutriation (as), and at the arrest (A) after elutriation for northern blot analysis of RNA. Control RNA samples from asynchronous wild-type (972h) cells (wt), asynchronous cdc2-33 cells (cdc2), and peak (P) and trough (T) cdc15+ mRNA cell cycle samples from the experiment shown in Figure 1B were included. The blot was hybridized consecutively with cdc15+, cdc22+ and adh1+ probes, the latter as a loading control. Quantification of each transcript against adh1+ is shown.
None
Fig. 8. Effect of overexpressing plo1+ on PCB-regulated gene transcription. (A) Time course of cdc15+ and spo12+ mRNA levels during the overexpression of plo1+ in cdc10-129 arrested cells, following enrichment of G2 cells by centrifugal elutriation (Mulvihill et al., 1999). Two cultures of asynchronous cdc10-129 cells containing pREP1:plo1+ were grown for 15 h in EMM at 25°C, in one case in the presence of thiamine (nmt:plo1+ off), and in the other in the absence of thiamine (nmt:plo1+ on). G2 cells were size selected by centrifugal elutriation, and immediately transferred to 36°C. Cell samples were taken before elutriation (as) and at hourly time points after elutriation (0–4), for northern blot analysis of RNA. Control RNA samples from asynchronous wild-type (972h) cells (wt), and peak (P) and trough (T) cdc15+ mRNA cell cycle samples from the experiment shown in Figure 1B were included. The blot was hybridized consecutively with cdc15+, spo12+, plo1+ and adh1+ probes, the latter as a loading control. Quantification of each transcript against adh1+ is shown. Representative phase contrast micrographs of cells in both cultures are shown. Bar = 10 µm. (B) Time course of cdc15+ and spo12+ mRNA levels during the overexpression of plo1+ in wild-type cells. A culture of asynchronous wild-type cells containing pREP1:plo1+ was grown in the presence of thiamine (nmt:plo1+ off) to early exponential stage of growth at 25°C. The culture was then split in two: one half grown in EMM in the absence of thiamine (nmt: plo1+ on), the other half in EMM in the presence of thiamine (nmt:plo1+ off), both for 15 h. Cell samples were taken for northern blot analysis of RNA at the times indicated. A control RNA sample from asynchronous wild-type (972h) cells (wt) was included. The blot was hybridized consecutively with cdc15+, spo12+, plo1+ and adh1+ probes, the latter as a loading control. Quantification of each transcript against adh1+ is shown. Representative phase contrast micrographs of cells in both cultures are shown. Bar = 10 µm. (C) Time course of cdc15+ and spo12+ mRNA levels during the overexpression of plo1+ in cdc7.A20 spg1.B8 arrested cells (Tanaka et al., 2001). A culture of asynchronous cdc7.A20 spg1.B8 cells containing pREP1:plo1+ were grown for 15 h in EMM at 25°C, in the absence of thiamine (nmt: plo1+ on). The culture was then split in two: one half grown at 25°C, and the other half transferred to 36°C. Cell samples were taken after temperature shift (0–6) for northern blot analysis of RNA. Control RNA samples from asynchronous wild-type (972h) cells (wt), and cdc7.A20 spg1.B8 cells containing pREP1:plo1+ grown in the presence of thiamine (nmt:plo1+ off) were included. The blot was hybridized consecutively with cdc15+, spo12+, plo1+ and adh1+ probes, the latter as a loading control. Quantification of each transcript against adh1+ is shown. Representative phase contrast micrographs of cells in both cultures are shown. Bar = 10 µm.
None
Fig. 9. Model outlining the regulation of M–G1-specific transcription in fission yeast by Plo1p. A group of eight genes which are expressed periodically during the fission yeast cell cycle, with a peak of expression at M–G1, are required for cytokinesis and septation. This co- ordinate expression is controlled by a combination of a promoter sequence present in the gene promoters called a PCB (pombe cell cycle box), bound by a transcription factor complex PBF (PCB-binding factor). PBF activity is regulated by Plo1p; thus, potentially, plo1+ regulates its own expression in a positive feedback loop.

Similar articles

Cited by

References

    1. Bahler J., Steever,A.B., Wheatley,S., Wang,Y.l., Pringle,J.R., Gould,K.L. and McCollum,D. (1998) Role of polo kinase and Mid1p in determining the site of cell division in fission yeast. J. Cell Biol., 143, 1603–1616. - PMC - PubMed
    1. Balasubramanian M.K., McCollum,D., Chang,L., Wong,K.C., Naqvi,N.I., He,X., Sazer,S. and Gould,K.L. (1998) Isolation and characterization of new fission yeast cytokinesis mutants. Genetics, 149, 1265–1275. - PMC - PubMed
    1. Bardin A.J. and Amon,A. (2001) Men and sin: what’s the difference? Nat. Rev. Mol. Cell Biol., 2, 815–826. - PubMed
    1. Broek D., Bartlett,R., Crawford,K. and Nurse,P. (1991) Involvement of p34cdc2 in establishing the dependency of S phase on mitosis. Nature, 349, 388–393. - PubMed
    1. Caligiuri M. and Beach,D. (1993) Sct1 functions in partnership with Cdc10 in a transcription complex that activates cell cycle START and inhibits differentiation. Cell, 72, 607–619. - PubMed

Publication types