. 2002 Nov 1;544(3):777-91.
doi: 10.1113/jphysiol.2002.026658.

Recruitment of Ca(2+) release channels by calcium-induced Ca(2+) release does not appear to occur in isolated Ca(2+) release sites in frog skeletal muscle

Affiliations

Recruitment of Ca(2+) release channels by calcium-induced Ca(2+) release does not appear to occur in isolated Ca(2+) release sites in frog skeletal muscle

Karine Fénelon et al. J Physiol. .

Abstract

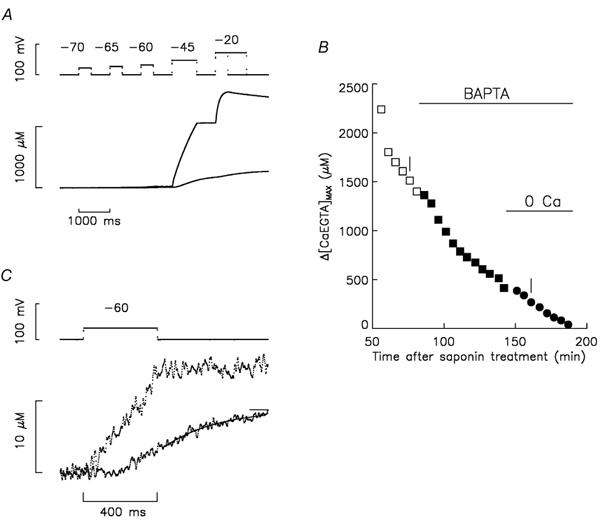
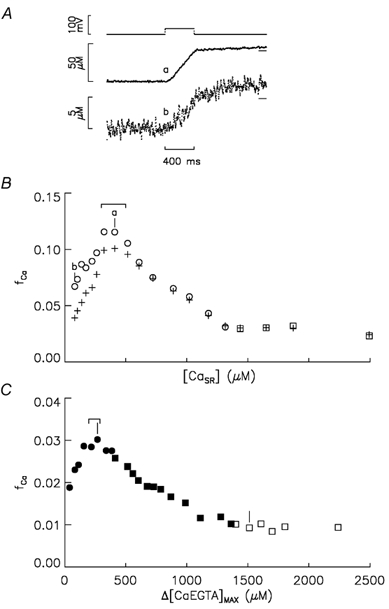
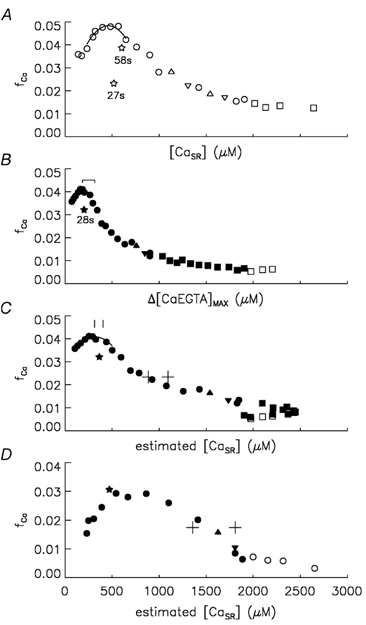
Ca(2+) release from the sarcoplasmic reticulum (SR) in skeletal muscle in response to small depolarisations (e.g. to -60 mV) should be the sum of release from many isolated Ca(2+) release sites. Each site has one SR Ca(2+) release channel activated by its associated T-tubular voltage sensor. The aim of this study was to evaluate whether it also includes neighbouring Ca(2+) release channels activated by Ca-induced Ca(2+) release (CICR). Ca(2+) release in frog cut muscle fibres was estimated with the EGTA/phenol red method. The fraction of SR Ca content ([Ca(SR)]) released by a 400 ms pulse to -60 mV (denoted f(Ca)) provided a measure of the average Ca(2+) permeability of the SR associated with the pulse. In control experiments, f(Ca) was approximately constant when [Ca(SR)] was 1500-3000 microM (plateau region) and then increased as [Ca(SR)] decreased, reaching a peak when [Ca(SR)] was 300-500 microM that was 4.8 times larger on average than the plateau value. With 8 mM of the fast Ca(2+) buffer BAPTA in the internal solution, f(Ca) was 5.0-5.3 times larger on average than the plateau value obtained before adding BAPTA when [Ca(SR)] was 300-500 microM. In support of earlier results, 8 mM BAPTA did not affect Ca(2+) release in the plateau region. At intermediate values of [Ca(SR)], BAPTA resulted in a small, if any, increase in f(Ca), presumably by decreasing Ca inactivation of Ca(2+) release. Since BAPTA never decreased f(Ca), the results indicate that neighbouring channels are not activated by CICR with small depolarisations when [Ca(SR)] is 300-3000 microM.


Figures

Figure 1
Figure 1. Effect of BAPTA on Δ[CaEGTA] and [CaEGTA]max vs. time of experiment
A, the top traces show superimposed voltage signals before and 77 min after the addition of BAPTA. Given in order of application, pulses to -70, -65, -60, -45 and -20 mV had durations of 400, 400, 400, 800 and 400 (or 1200) ms, respectively. The duration of the period at -90 mV after the pulse to -60 mV was 600 ms. The bottom traces show the corresponding Δ[CaEGTA] signals. B, plots of Δ[CaEGTA]max vs. time after saponin treatment to permeabilise the fibre segments in the end pools. At 12 min, 0.8 mm phenol red was introduced into the end pools. The initial end-pool solution contained Ca and no BAPTA (□). At 84 min, the end-pool solution was exchanged for the one containing Ca and 8 mm BAPTA (▪). At 145 min, the end-pool solution was exchanged for the one containing no Ca and 8 mm BAPTA (•). The period of time between points was usually 5 min. C shows the same signals as in A for the pulse to -60 mV on an expanded scale. The interval of time between points was 1.25 ms. Fibre reference O05011. The following parameter values are for the stimulations before and after adding BAPTA, respectively, in A and C: fibre diameter, 112 and 106 μm; concentration of phenol red at the optical site, 1.34 and 2.56 mm; pHR, 6.959 and 7.064; Ih, -24 and -32 nA; Capp, 0.01184 and 0.01274 μF; cm, 0.164 and 0.173 μF cm−1; ri, 2.57 and 2.85 MΩ cm−1.
Figure 2
Figure 2. Delayed turn-off of Ca2+ release at reduced [CaSR] and fCa vs. [CaSR] with and without BAPTA
A, the top traces show two superimposed voltage pulses to -60 mV in an experiment in which BAPTA was not added. The bottom traces labelled a and b show the corresponding Δ[CaEGTA] signals obtained, respectively, when [CaSR] was 409 and 82 μm (see text for details). B plots fCa associated with pulses to -60 mV vs. [CaSR] from an experiment containing no BAPTA. The cross and open symbols were obtained from Δ[CaEGTA]after values determined, respectively, just after the pulse to -60 mV (lower line segments in A) and the average value 900-1000 ms after the pulse (higher line segments in A). □ and ○ were obtained, respectively, with and without Ca in the end pools. The points labelled a and b correspond to the similarly labelled traces in A. The range indicates [CaSR] values of 300-500 μm. C plots fCa associated with pulses to -60 mV vs. [CaEGTA]max from the experiment in Fig. 1 in which 8 mm BAPTA was added. As in Figs 1 and 2b, filled and open symbols were obtained with and without BAPTA, respectively, and squares and circles were obtained with and without Ca, respectively, in the end pools. The two vertical lines mark the stimulations shown in Fig. 1A and C. The range indicates points when the estimated [CaSR] was 300-500 μm. Fibre reference for panels A and B is N07011. The following parameter values are for the first and last points in B, respectively: time after saponin treatment, 60 and 153 min; fibre diameter, 97 and 97 μm; concentration of phenol red at the optical site, 0.83 and 2.10 mm; pHR, 6.885 and 6.957; Ih, -51 and -65 nA; Capp, 0.00862 and 0.00852 μF; cm, 0.111 and 0.107 μF cm−1; ri, 3.42 and 3.42 MΩ cm−1.
Figure 3
Figure 3. Plots of fCa vs. [CaSR] in control and BAPTA experiments and tests of reversibility
As in Figs 1 and 2, filled and open symbols were obtained with and without BAPTA, respectively, and squares and circles were obtained with and without Ca, respectively, in the end pools. ▿, ⋆ and ▵ show points when short-term reversibility was tested, which was all done without Ca in the end pools. See text for meaning of symbols. A shows a plot of fCa vs. [CaSR] in a control experiment. Fibre reference O29011. B shows a plot of fCa vs. Δ[CaEGTA]max in an experiment in which BAPTA was added. As in Fig. 2C, the range indicates points when the estimated [CaSR] was 300-500 μm. Fibre reference O10011. C shows the same fCa data as in B except that now it is plotted vs. [CaSR], estimated as described in Appendix A. The cross symbols and vertical line segments show estimates of [CaSR]1/2 and [CaSR]peak, respectively. In each case, the highest [CaSR] value was obtained with no pH correction and with the higher value of DBAPTA (1.2 × 10⁻⁶ cm2 s−1) and the lowest [CaSR] value with 0.2 pH units added to the apparent pH recorded by phenol red and with the lowest value of DBAPTA (0.6 × 10⁻⁶ cm2 s−1). D shows fCa vs. [CaSR] in the same format as in C from an experiment in which Ca was removed relatively early from the end pools. Fibre reference O12011. See text for details.

Similar articles

Cited by

References

    1. Block BA, Imagawa T, Campbell KP, Franzini-Armstrong C. Structural evidence for direct interaction between the molecular components of the transverse tubule/sarcoplasmic reticulum junction in skeletal muscle. Journal of Cell Biology. 1988;107:2587–2600. - PMC - PubMed
    1. Chandler WK, Hui CS. Membrane capacitance in frog cut twitch fibers mounted in a double Vaseline-gap chamber. Journal of Physiology. 1990;96:225–256. - PMC - PubMed
    1. González A, Kirsch WG, Shirokova N, Pizarro G, Brum G, Pessah IN, Stern MD, Cheng H, Ríos E. Involvement of multiple intracellular release channels in calcium sparks of skeletal muscle. Proceedings of the National Academy of Sciences of the USA. 2000;97:4380–4385. - PMC - PubMed
    1. Hille B, Campbell DT. An improved Vaseline gap voltage clamp for skeletal muscle fibers. Journal of General Physiology. 1976;67:265–293. - PMC - PubMed
    1. Hirota A, Chandler WK, Southwick PL, Waggoner AS. Calcium signals recorded from two new purpurate indicators inside frog cut twitch fibers. Journal of General Physiology. 1989;94:597–631. - PMC - PubMed

Publication types

Substances

LinkOut - more resources