. 2002 Nov 1;544(3):985-94.
doi: 10.1113/jphysiol.2002.024844.

Interaction of pre-programmed control and natural stretch reflexes in human landing movements

Affiliations

Interaction of pre-programmed control and natural stretch reflexes in human landing movements

Martin J N McDonagh et al. J Physiol. .

Abstract

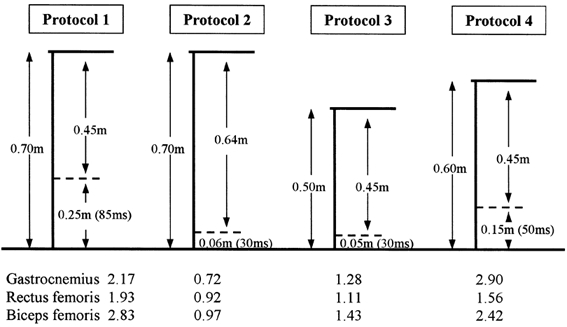
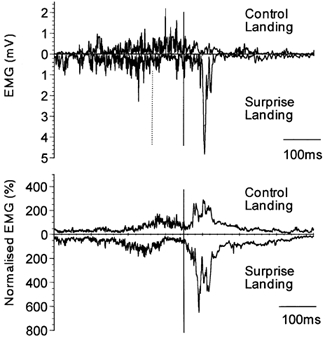
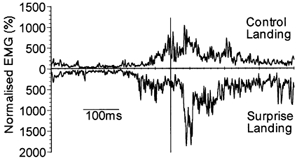
Pre-programmed mechanisms of motor control are known to influence the gain of artificially evoked stretch reflexes. However, their interaction with stretch reflexes evoked in the context of unimpeded natural movement is not understood. We used a landing movement, for which a stretch reflex is an integral part of the natural action, to test the hypothesis that unpredicted motor events increase stretch reflex gain. The unpredicted event occurred when a false floor, perceived to be solid, collapsed easily on impact, allowing the subjects to descend for a further 85 ms to a solid floor below. Spinal stretch reflexes were measured following solid floor contact. When subjects passed through the false floor en route to the solid floor, the amplitude of the EMG reflex activity was double that found in direct falls. This was not due to differences in joint rotations between these conditions. Descending pathways can modify H- and stretch-reflex gain in man. We therefore manipulated the time between the false and real floor contacts and hence the time available for transmission along these pathways. With 30 ms between floors, the enhancement of the reflex was extinguished, whereas with 50 ms between floors it reappeared. This excluded several mechanisms from being responsible for the doubling of the reflex EMG amplitude. It is argued that the enhanced response is due to the modulation of reflex gain at the spinal level by signals in descending pathways triggered by the false platform. The results suggest the future hypothesis that this trigger could be the absence of afferent signals expected at the time of false floor impact and that salient error signals produced from a comparison of expected and actual sensory events may be used to reset reflex gains.


Figures

Figure 1
Figure 1. Schematic representation of the four surprise landing protocols
The top, continuous line represents the take-off platform, the dashed line represents the false floor, and the bottom, continuous line represents the solid landing floor. Fall distances are shown together with the fall time between false and real floors. Also shown are the reflex EMG amplitudes (means for 10 subjects) following hard floor impact under surprise conditions expressed as a ratio of those found in control falls to hard floors at the same distance.
Figure 4
Figure 4. Protocol 1: 85 ms between floors. Gastrocnemius muscle EMG traces for 0.70 m and surprise landings
The upper panel shows data from a single subject; the lower panel shows the average of the data from 10 subjects. In each panel, the upper trace is a 0.70 m landing and the lower, inverted trace is the surprise landing. The traces are aligned at the point of true contact with the ground at 0.70 m, as indicated by the continuous cursor. In the upper panel, the dashed cursor indicates the time of contact with the false floor. In this and subsequent figures, the group data have been normalised as described in Methods and false floor contact time is only shown for single-subject, single-trial data, not for data averaged across subjects.
Figure 2
Figure 2. Protocol 1: 85 ms between floors. Recordings from one subject performing a single, control landing to a solid floor at 0.70 m
A pressure-pad switch on the take-off platform indicated the moment of take-off (first dashed cursor). In this and subsequent figures, cursors are shown as dashed vertical lines and are numbered sequentially from left to right. An infrared signal (second dashed cursor) indicated when the subject's feet passed a point 0.45 m below the take-off point. Another pressure pad switch (trace not shown) on the floor indicated the final ground contact as shown by the third dashed cursor. An increasing positive value in the electrogoniometer signal represents extension in the knee and dorsiflexion in the ankle. EMG signals have been full-wave rectified.
Figure 3
Figure 3. Protocol 1: 85 ms between floors. Recordings from one subject performing a single, surprise landing
The pressure-pad switch on the take-off platform registered the moment of take-off, as indicated by the first dashed cursor. The infrared detection system registered the moment of expected ground contact (false floor) at 0.45 m, as indicated by the second dashed cursor. Another pressure-pad switch on the floor provided the moment of ground contact at 0.70 m (not shown), as indicated by the third cursor. EMG signals have been full-wave rectified. The directionality of electrogoniometer signals is the same as in Fig. 2.
Figure 5
Figure 5. Protocol 1: 85 ms between floors. Rectus femoris muscle EMG traces for 0.70 m and surprise landings
Average of the data from 10 subjects. The upper trace is the 0.70 m landing and the lower, inverted trace is the surprise landing. All traces are aligned to the point of ground contact at 0.70 m, as indicated by the cursor.
Figure 6
Figure 6. Reflex amplitude plotted against velocity of joint rotation
Data from the soleus (A), gastrocnemius (B) and rectus femoris muscles (C). On each graph the group data for each of the three conditions of 0.45 m landing (▪), 0.70 m landing (•) and surprise landing (▴) are plotted. Joint velocity was measured as the average velocity in the first 10 ms of joint rotation after ground contact. Reflex amplitude was normalised before averaging. Data are the means ± s.e.m. for determinations from 10 subjects.
Figure 7
Figure 7. Protocol 3: 30 ms between floors. Rectus femoris muscle EMG traces for 0.50 m and surprise landings
The upper panel shows data from a single subject. The lower panel shows the average of the data from 10 subjects. In both records, the upper trace is the 0.50 m landing and the lower, inverted trace is the surprise landing (false floor at 0.45 m, solid floor at 0.50 m). All traces are aligned at the moment of true contact with the ground at 0.50 m, which is indicated by the continuous cursor.

Similar articles

Cited by

References

    1. Aimonetti J, Vedel J, Schmied A, Pagni S. Mechanical cutaneous stimulation alters Ia presynaptic inhibition in human wrist extensor muscles: a single motor unit study. Journal of Physiology. 2000;522:137–145. - PMC - PubMed
    1. Barnes WJP. Proprioceptive influences on motor output during walking in the crayfish. Journal of Physiology. 1977;73:543–564. Paris. - PubMed
    1. Bisdorff AR, Bronstein AM, Gresty MA, Wolsley C, Davies A, Young A. EMG-responses to sudden onset free fall. Acta Otolaryngologica: Supplementum. 1995;520:347–349. - PubMed
    1. Burke D, Gracies JM, Meunier S, Pierrot-Deseilligny E. Changes in presynaptic inhibition of afferents to propriospinal-like neurons in man during voluntary contractions. Journal of Physiology. 1992;449:673–687. - PMC - PubMed
    1. Coulter JD. Sensory transmission through lemniscal pathway during voluntary movement in the cat. Journal of Neurophysiology. 1974;37:831–845. - PubMed

LinkOut - more resources